After a strong year for the value premium, investors are curious about what that means for value performance for this year.
Investors haven’t missed the boat. Staying consistent in your exposure to the value premium can be the most reliable way to capture long-term returns.
• Value stocks are expected to perform better than growth stocks every day, because a lower relative price is associated with a higher expected return.
• Historical data suggest a positive value premium regardless of its performance in the prior year.
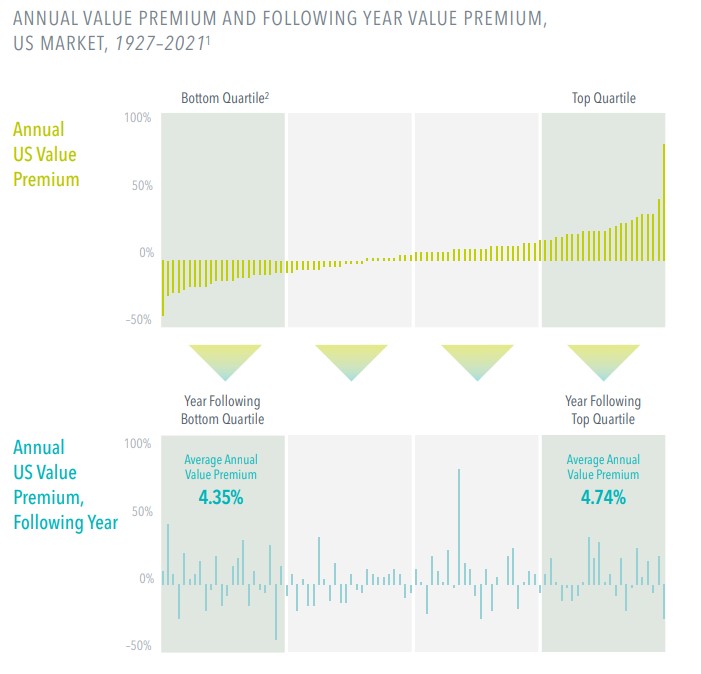
• To evaluate the value premium’s performance from one year to the next, we first arranged years based on the annual value premium, then looked at the next year’s performance.
• The top quartile years—those with the strongest value premium performance—were followed by an average annual value premium of 4.74%. The bottom quartile—or the weakest years for the value premium—were followed by an average annual value premium of 4.35%.
References:
1. Yearly premiums in top chart are arranged from low to high rather than chronologically, covering 1975–2021. Premiums in bottom chart are arranged
in the order of the top chart, but one year later in each instance, to show next-year performance.
Past performance is not a guarantee of future results. Actual returns may be lower. Investing risks include loss of principal and fluctuating value. There is no guarantee an investment strategy will be successful.
Indices are not available for direct investment; therefore, their performance does not reflect the expenses associated with the management of an actual portfolio.
In USD. Annual value premium is the return difference between the Fama/French US Value Research Index and the Fama/French US Growth Research Index. Source: CRSP and Compustat data calculated by Dimensional.
Fama/French data provided by Fama/French.
Fama/French US Value Research Index: Provided by Fama/French from CRSP securities data. Includes the lower 30% in price-to-book of NYSE securities (plus NYSE Amex equivalents since July 1962 and Nasdaq equivalents
since 1973).
Fama/French US Growth Research Index: Provided by Fama/French from CRSP securities data. Includes the higher 30% in price-to-book of NYSE securities (plus NYSE Amex equivalents since July 1962 and Nasdaq
equivalents since 1973).
Eugene Fama and Ken French are members of the Board of Directors of the general partner of, and provide consulting services to, Dimensional Fund Advisors LP.
This information is intended for educational purposes and should not be considered a recommendation to buy or sell a particular security.
AUSTRALIA and NEW ZEALAND: This material is issued by DFA Australia Limited (AFS License No. 238093, ABN 46 065 937 671). This material is provided for information only. No account has been taken of the objectives, financial situation or needs of any particular person. Accordingly, to the extent this material constitutes general financial product advice, investors should, before acting on the advice, consider the appropriateness of the advice, having regard to the investor’s objectives, financial situation and needs. Investors should also consider the Product Disclosure Statement (PDS) and the target market determination (TMD) that has been made for each financial product either issued or distributed by DFA Australia Limited prior to acquiring or continuing to hold any investment. Go to au.dimensional.com/funds to access a copy of the PDS or the relevant TMD. Any opinions expressed in this material reflect our judgement at the date of publication and are subject to change.