Recent history reminds us that emerging markets can be volatile and can lag developed markets. However, emerging markets represent a meaningful piece of the global investment opportunity set.
A disciplined but flexible approach, which Dimensional has used for decades, can provide the means to access the emerging markets opportunity set effectively.
Recent Performance in Perspective
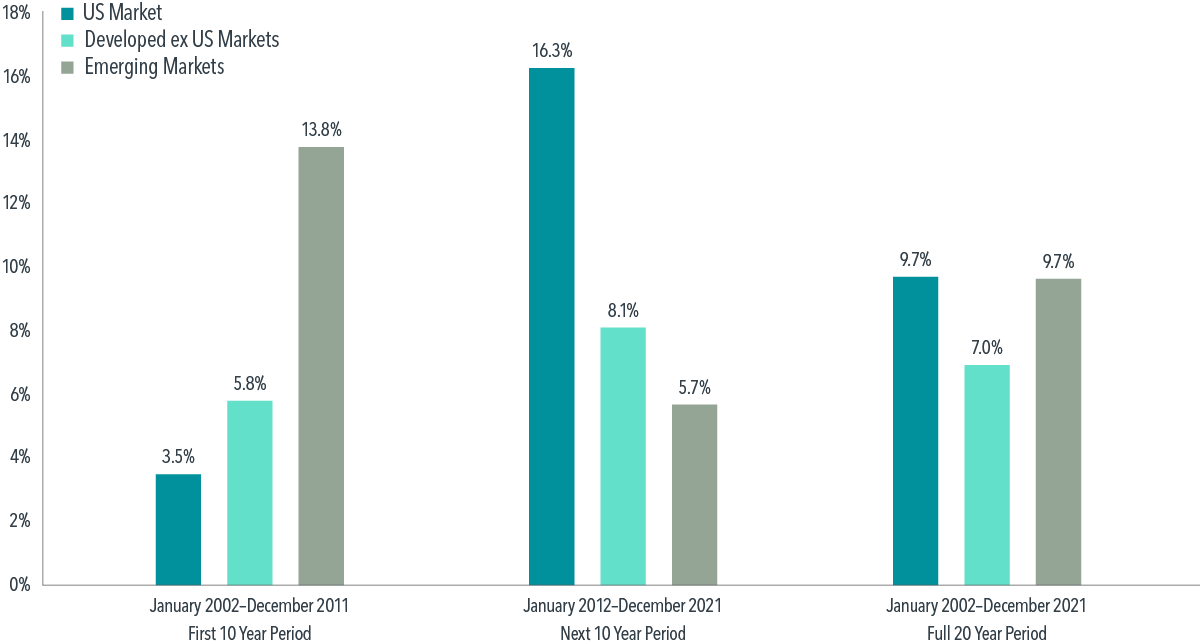
In recent years, the returns of emerging markets have lagged those of developed markets, with emerging markets underperforming US stocks by over 10 percentage points on an annualised basis over the past 10 years (see Exhibit 1).
While recent returns have been disappointing, it is not uncommon to see periods when the reverse is true.
For example, just looking back to the prior 10 years (2002–2011), emerging markets outperformed US stocks by more than 10 percentage points and other developed markets by 8 points on an annualised basis.
EXHIBIT 1
Performance of US, Developed ex US, and Emerging Markets, January 2002–December 2021
Past performance is no guarantee of future results.
Over the entire 20-year period (2002–2021), emerging markets posted an annualised compound return of 9.7%, matching the return of US stocks and outperforming other developed markets.
A Closer Look at Emerging Markets Country Performance
Investing across a broad set of emerging markets countries can help improve the reliability of investment outcomes.
History shows that returns of individual emerging markets countries can be volatile and that dispersion across individual country returns can be wide.
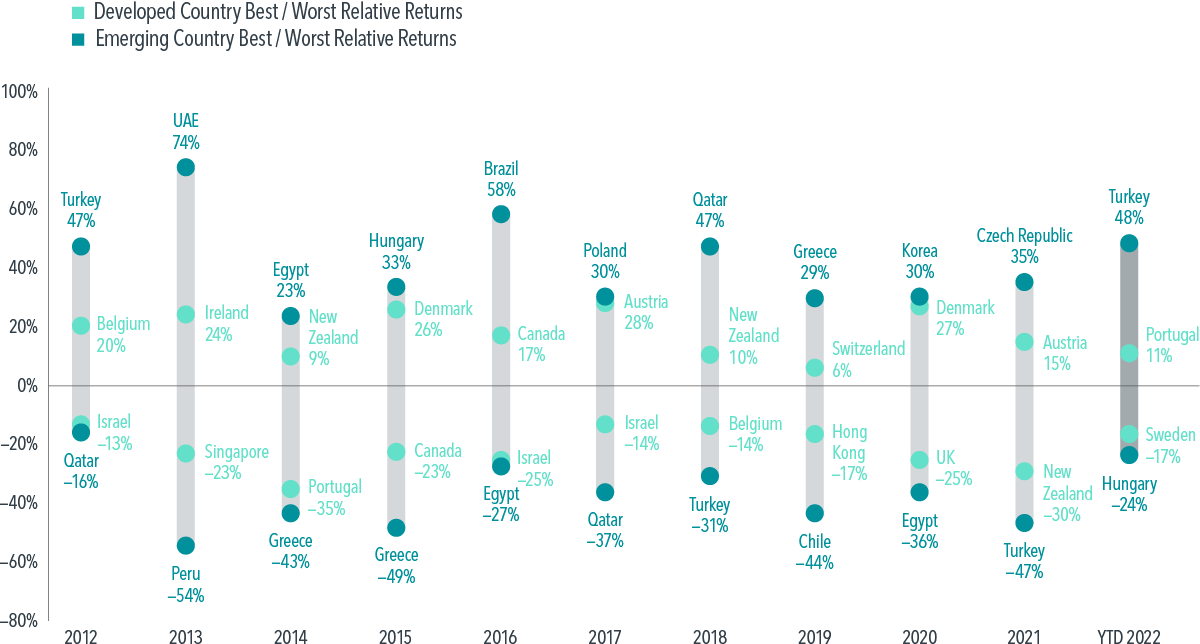
Substantial differences in returns can exist between the best-performing and worst-performing country.
Exhibit 2 shows that these differences are often larger for emerging markets than for developed markets. Countries that rank among the worst performers in one year may rank among the best in subsequent periods.
For example, Turkey had extreme underperformance in 2021 but has outperformed other emerging markets year-to-date through September 2022.
EXHIBIT 2
Relative Returns of Emerging and Developed Countries
Past performance is no guarantee of future results.
Concentrating in a few countries may expose investors to extreme outcomes. By holding a broadly diversified portfolio, investors are instead well-positioned to capture returns wherever they occur.
The Evolving Emerging Markets Opportunity Set
Emerging markets represent a meaningful opportunity set for investors.
The size and composition of the investible universe in emerging markets have steadily evolved since the late 1980’s, when most comprehensive data sets and benchmarks for emerging markets begin.
At the beginning of 1990, emerging markets represented $63 billion and by the end of 2021, over $10 trillion, a staggering increase of well over a hundredfold.
In the same period, developed markets grew by less than 10 times their value.
Much of this increase can be attributed to the changing composition of emerging markets, as China, India, Korea, and Taiwan became the largest emerging markets.
Over the years, major geopolitical, economic, and demographic changes have contributed to shifting weights for individual countries and companies within emerging markets, but in aggregate they have continued to grow.
As of the end of 2021, the total free-float adjusted market capitalisation of Dimensional’s emerging markets universe was $10.5 trillion and included 24 countries and over 7,000 securities.
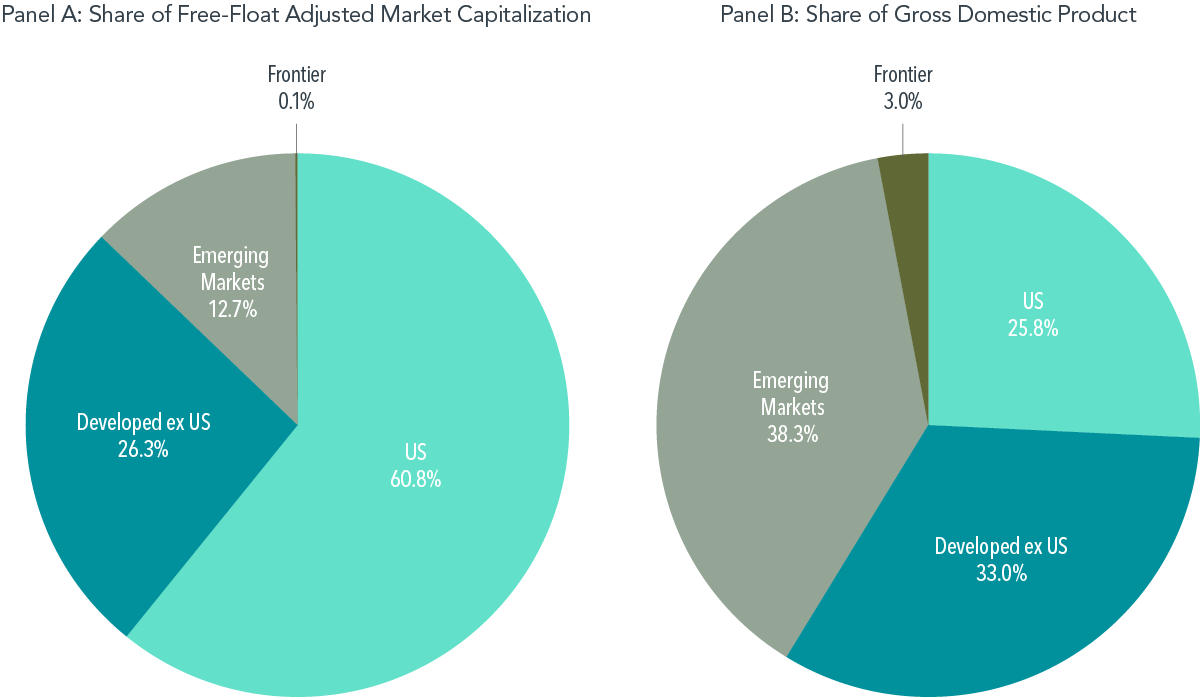
As shown in Panel A of Exhibit 3, emerging markets represented 12.7% of global markets’ free-float adjusted market capitalisation.
Measured by gross domestic product (GDP), emerging markets’ share increases to 38.3% (Panel B), reflecting the fact that emerging markets typically have smaller market capitalisations compared to GDP than most developed markets.
Regardless of the metric, emerging markets represent a significant component of global markets.
EXHIBIT 3
World Market Breakdown, as of December 31, 2021
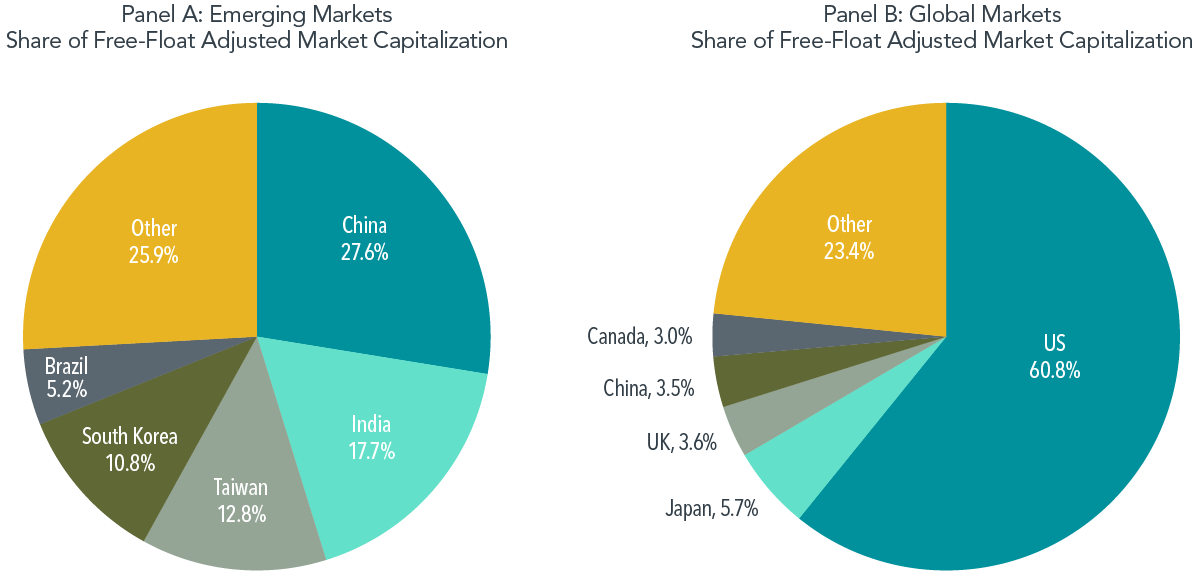
As shown in Exhibit 4, Panel A, the five largest countries in terms of market capitalisation comprised approximately three-quarters of emerging markets at the end of 2021.
Much attention has been paid to the growth of China over the past decade, which represented 28% of the emerging markets universe at the beginning of 2022.
China’s growing share has been driven primarily by new equity issuance and new avenues for foreign investors to gain exposure to Chinese companies, including securities listed on the local Shanghai and Shenzhen stock exchanges through Hong Kong Stock Connect programs.
China’s weight in the emerging markets has prompted many questions from investors on issues ranging from benchmarking to geopolitical risk.
While these issues are complex, it can be helpful to consider the weight of China and other individual emerging markets from a global perspective.
Panel B of Exhibit 4 shows the weights of the top five countries in the global universe. Compared to its 28% weight in the emerging markets universe, China’s weight was just 3.5% in the global market, making it the fourth-largest country after the US, Japan, and the UK.
EXHIBIT 4
Largest Country Weights in Emerging and Global Markets, as of September 30, 2022
In addition to changes in size and country composition, emerging markets have undergone important improvements in their market mechanisms and microstructures over the past few decades.
Many have broadly adopted international accounting and reporting practices.
Our analysis suggests more than 90% of the firms in most emerging markets now report their annual financial statements according to International Financial Reporting Standards (IFRS) or US Generally Accepted Accounting Practices (GAAP).
In countries like China, India, and Taiwan, the national standards have substantially converged toward IFRS.
This has helped improve the reliability and transparency of financial data in emerging markets.
Over time, emerging markets have also generally become more open to foreign investors due to reduced constraints on capital mobility.
Evidence of these developments includes fewer instances of market closings, capital lockups, and trading suspensions of individual stocks in many markets.
However, navigating geopolitical events and potential market disruptions is still important when investing in emerging markets. Russia’s invasion of Ukraine in 2022 provides a stark example.
The US and other Western governments issued sweeping new sanctions directed at Russia in response to the invasion.
Dimensional had previously reduced the weight of Russia in our emerging markets and global equity portfolios after sanctions were imposed in 2014 following the annexation of Crimea.
In January 2022, we halted further purchases of Russian stocks, and in March we removed Russia from our list of approved markets for investment.
We believe that the most effective way to mitigate the risk of these types of unexpected events is through broad diversification and a flexible investment process.
Implementation Matters
Investing in emerging markets brings unique challenges, and since Dimensional first started investing in emerging markets almost 30 years ago, we have employed a flexible approach to meet those challenges.
Flexibility can be critical in determining which markets and stocks are eligible, which security lines to buy when multiple share classes trade for the same stock, and when and how to trade them while avoiding unnecessary and costly index constraints.
By considering a combination of qualitative and quantitative criteria to determine which countries, exchanges, and securities are eligible, we have implemented changes in our eligible investment universe over time.
Those considerations include the costs and frictions associated with accessing these markets. We apply certain minimum criteria in areas like market liquidity, regulation at the exchange level, listing requirements, and accounting standards.
The addition of countries that meet our eligibility criteria helps improve diversification in our strategies that invest in emerging markets.
Once a market is eligible for investment, investors often have the option of trading more than one line of shares for the same emerging markets company.
Thailand, for example, imposes restrictions on foreign ownership that may result in local and foreign shares trading for the same stock at different prices and volumes.
Our approach is dynamic. Portfolio Managers decide which line to trade based on considerations such as prices, costs, liquidity, market regulation, and sometimes taxes, all of which can fluctuate from day to day.
This approach contrasts with a more static approach of tracking the specific securities held by an index.
Flexibility in execution can help lower costs in our portfolios and thereby improve returns to investors, particularly in emerging markets, where trading costs can be higher than in developed markets.
Dimensional uses a flexible trading approach every day that seeks to participate in available market liquidity and avoid the costs of seeking immediacy in trading execution.
Our trading philosophy is consistent across stocks and markets.
However, we conduct rigorous research on how to price, size, time, and route our orders across different market microstructures and tailor our approach appropriately.
We believe a tailored approach is particularly important in emerging markets, where market microstructures tend to be less uniform than in developed markets.
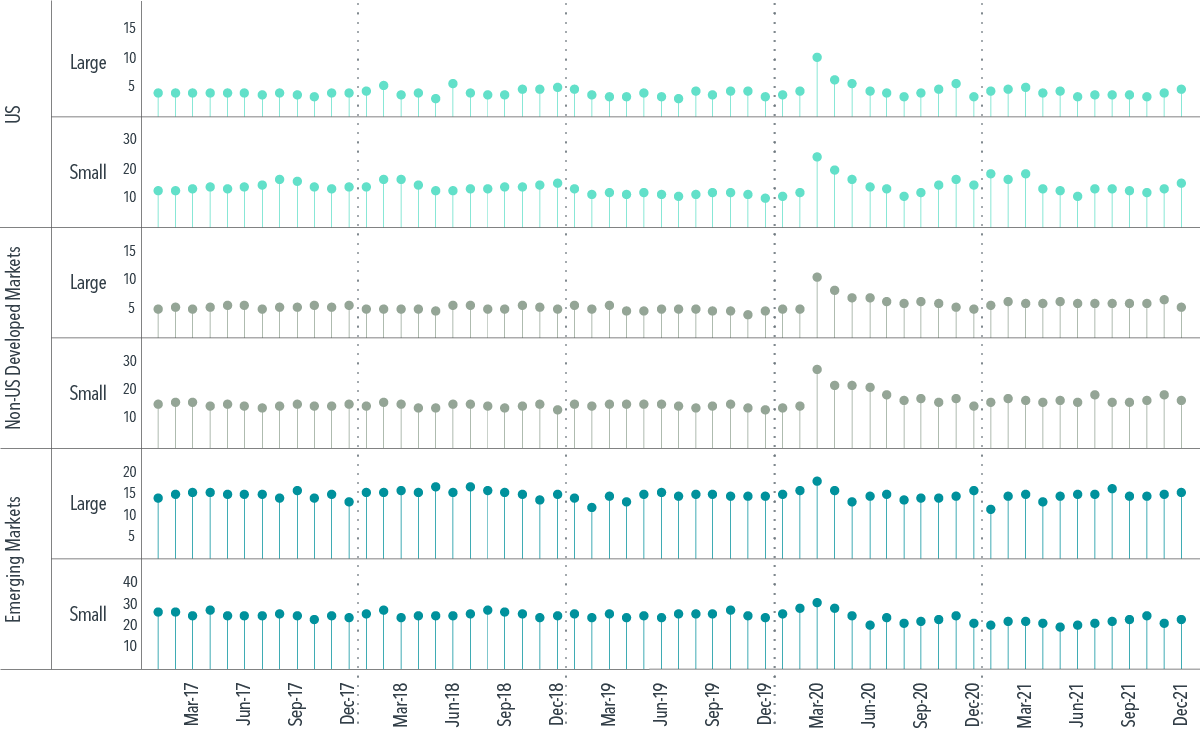
Exhibit 5 illustrates the estimated price advantage of Dimensional’s flexible trading approach compared to one that seeks immediacy.
We compare the price advantage across regions and between large capitalisation and small capitalisation stocks.
The data suggest that the benefits of flexible trading are positive in all categories and time periods shown, but even more beneficial in areas with higher potential trading costs, like smaller capitalisation stocks and emerging markets.
EXHIBIT 5
Relative Price Advantage of Flexible Trading
Past performance is no guarantee of future results.
Navigating the Opportunities
Emerging markets represent a meaningful opportunity set within global markets. They continue to evolve in their structures, market mechanisms, and accessibility.
Investors in emerging markets can benefit from a long-term perspective as well as expertise and flexibility in navigating these rapidly changing, heterogenous markets.
Dimensional offers investors broadly diversified exposure to emerging markets equities along with the systematic pursuit of higher expected returns.
Through our decades of experience, we have built robust, systematic, and scalable processes for navigating these markets. Our expertise enables us to pursue opportunities to improve performance and reduce costs every day.
APPENDIX
Eligible Universe Information
Source: Dimensional, using CRSP and Bloomberg. Data is as of September 30, 2022. Country eligibility determined by Dimensional for developed and emerging markets, and by MSCI classification for frontier markets. Market cap data is free-float adjusted and meets minimum liquidity and listing requirements. Minimum liquidity is $50,000 median daily volume in the current month, and minimum total market capitalization is $10 million for the US and $50 million elsewhere. Includes equity and REIT securities. China A-Shares only includes those trading on Hong Kong Stock Connect, at a 25% inclusion factor. Totals may not equal 100% due to rounding. For educational purposes; should not be used as investment advice.
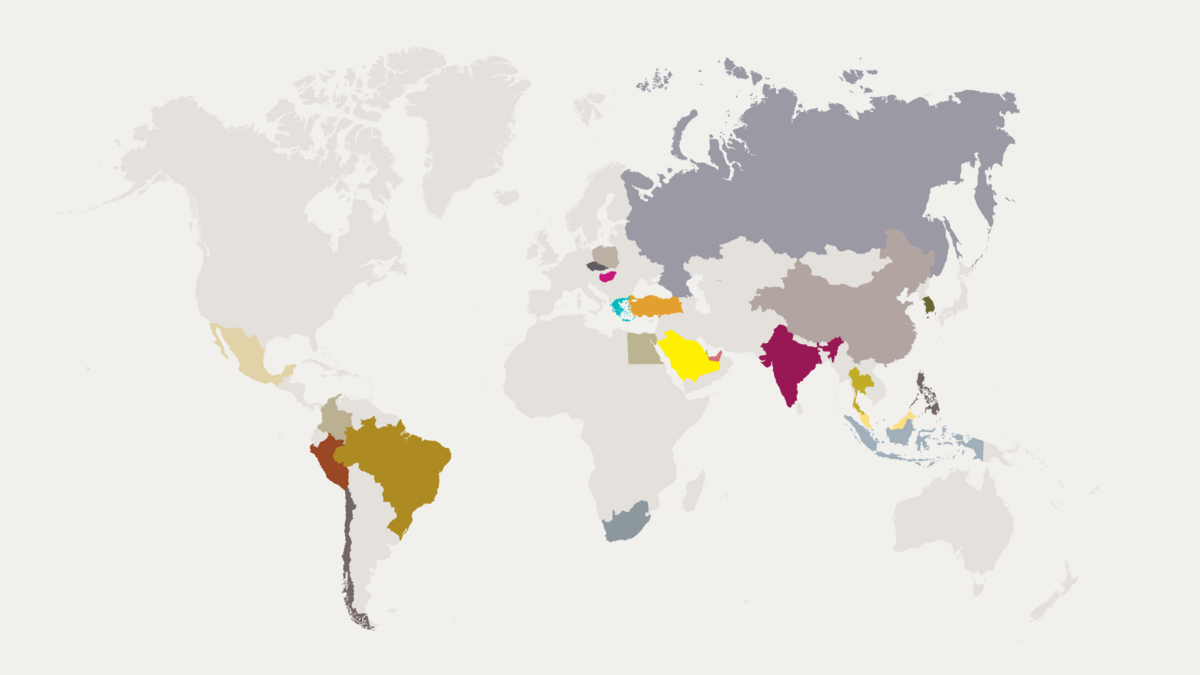
Dimensional’s eligible emerging markets universe: The countries included in Dimensional’s emerging markets universe are Brazil, Chile, China, Colombia, Czech Republic, Egypt, Greece, Hungary, India, Indonesia, Korea, Malaysia, Mexico, Peru, Philippines, Poland, Qatar, Saudi Arabia, South Africa, Taiwan, Thailand, Turkey, and United Arab Emirates.
Dimensional’s eligible global markets universe: The countries included in Dimensional’s global universe are Australia, Austria, Bahrain, Bangladesh, Belgium, Brazil, Canada, Chile, China, Colombia, Croatia, Czech Republic, Denmark, Egypt, Estonia, Finland, France, Germany, Greece, Hong Kong, Hungary, India, Indonesia, Ireland, Israel, Italy, Ivory Coast, Japan, Jordan, Kazakhstan, Korea, Kenya, Kuwait, Lebanon, Lithuania, Malaysia, Mauritius, Mexico, Morocco, Netherlands, New Zealand, Nigeria, Norway, Oman, Peru, Philippines, Poland, Portugal, Qatar, Romania, Russia, Saudi Arabia, Senegal, Serbia, Singapore, Slovenia, South Africa, , Spain, Sri Lanka, Sweden, Switzerland, Taiwan, Thailand, Tunisia, Turkey, United Arab Emirates, the UK, the US, and Vietnam.
The information in this material is intended for the recipient’s background information and use only. It is provided in good faith and without any warranty or representation as to accuracy or completeness. Information and opinions presented in this material have been obtained or derived from sources believed by Dimensional to be reliable, and Dimensional has reasonable grounds to believe that all factual information herein is true as at the date of this material. It does not constitute investment advice, a recommendation, or an offer of any services or products for sale and is not intended to provide a sufficient basis on which to make an investment decision. Before acting on any information in this document, you should consider whether it is appropriate for your particular circumstances and, if appropriate, seek professional advice. It is the responsibility of any persons wishing to make a purchase to inform themselves of and observe all applicable laws and regulations. Unauthorised reproduction or transmission of this material is strictly prohibited. Dimensional accepts no responsibility for loss arising from the use of the information contained herein.
This material is not directed at any person in any jurisdiction where the availability of this material is prohibited or would subject Dimensional or its products or services to any registration, licensing, or other such legal requirements within the jurisdiction.
“Dimensional” refers to the Dimensional separate but affiliated entities generally, rather than to one particular entity. These entities are Dimensional Fund Advisors LP, Dimensional Fund Advisors Ltd., Dimensional Ireland Limited, DFA Australia Limited, Dimensional Fund Advisors Canada ULC, Dimensional Fund Advisors Pte. Ltd., Dimensional Japan Ltd. and Dimensional Hong Kong Limited. Dimensional Hong Kong Limited is licensed by the Securities and Futures Commission to conduct Type 1 (dealing in securities) regulated activities only and does not provide asset management services.
Risks
Investments involve risks. The investment return and principal value of an investment may fluctuate so that an investor’s shares, when redeemed, may be worth more or less than their original value. Past performance is not a guarantee of future results. There is no guarantee strategies will be successful.
Diversification does not eliminate the risk of market loss.
AUSTRALIA
This material is issued by DFA Australia Limited (AFS Licence No. 238093, ABN 46 065 937 671). This material is provided for information only. No account has been taken of the objectives, financial situation or needs of any particular person. Accordingly, to the extent this material constitutes general financial product advice, investors should, before acting on the advice, consider the appropriateness of the advice, having regard to the investor’s objectives, financial situation and needs. Investors should also consider the target market determination that has been made for each financial product either issued or distributed by DFA Australia Limited prior to proceeding with any investment. Investors should also consider the Product Disclosure Statement (PDS) and the target market determination (TMD) that has been made for each financial product either issued or distributed by DFA Australia Limited prior to acquiring or continuing to hold any investment. Go to au.dimensional.com/funds to access a copy of the relevant target market determination. Any opinions expressed in this material reflect our judgement at the date of publication and are subject to change.


