
When you leave your waiter or waitress a tip, do you round it to a whole-dollar amount and often in multiples of $5?
Does a 60th birthday seem more significant than a 59th?
If you answered yes to these questions, you’re not alone. Most of us prefer round numbers.
This preference leads many investors to review results by calendar year and to consider 10-year periods when evaluating long-term returns. People tend to place greater emphasis on the latest period due to recency bias and to extrapolate recent results into the future.
For these reasons, we should put recent performance into the proper perspective.
During the most recent 10 years, equities delivered relatively strong performance amid volatility and uncertainty, with the MSCI All Country World IMI Index earning an annualised return of 8.49% through 2022.
Within equities, higher-profitability stocks generally outperformed lower-profitability stocks globally and small caps outperformed large caps in regions outside the US, while the underperformance of value stocks garnered a lot of attention.1,2
Despite a strong rebound from late 2020 through 2022, the MSCI All Country World IMI Value Index underperformed the market, delivering an annualised 7.25% over the same 10-year period.3
While a positive premium is never guaranteed, the odds of realising one are decidedly in your favour and improve the longer you stay invested.
We expect positive market, size, value, and profitability premiums, but also recognise that realised premiums are volatile and can sometimes be negative.
Although a negative premium can be disappointing, it is not unprecedented – and we can look at historical data to gauge how often each premium has been negative.
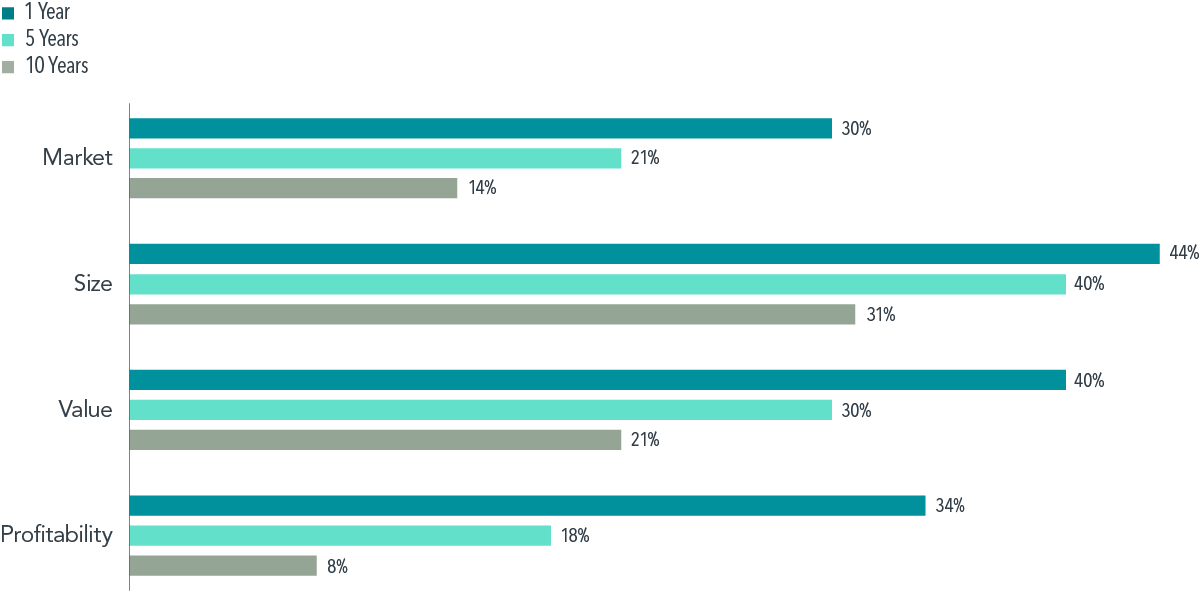
For example, Exhibit 1 shows the frequency of experiencing a negative premium in the US over rolling one-, five-, and 10-year periods as far back as the data are available.
As you can see, negative premiums occur from time to time. While a positive premium is never guaranteed, the odds of realising one are decidedly in your favour and improve the longer you stay invested.
EXHIBIT 1
How Often Have Premiums Been Negative?
Percentage of rolling one-, five-, and 10-year periods with negative premiums, US market through December 31, 2022
Past performance is not a guarantee of future results. Actual returns may be lower.
This analysis looks at each premium individually. What if you integrate all four premiums in pursuit of higher expected returns?
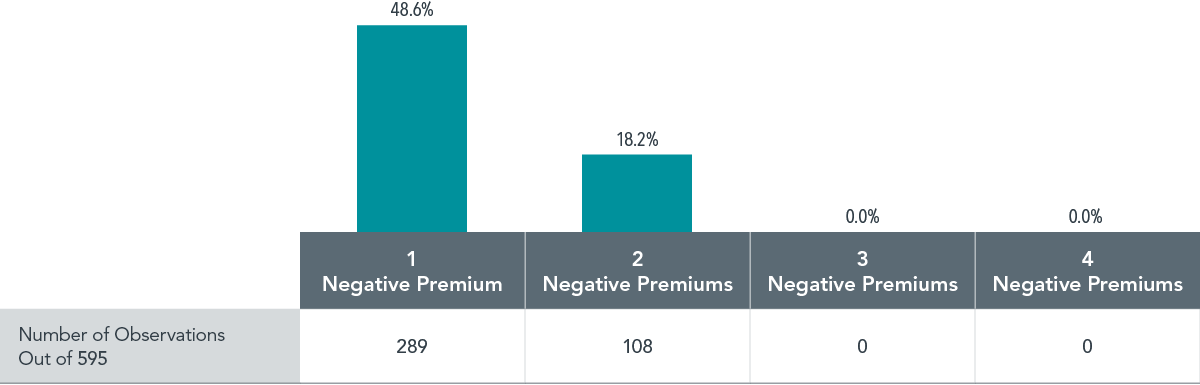
A different approach is to calculate the frequency that one, two, three, or all four of the premiums were negative over rolling 10-year periods from July 1963 to December 2022.
As shown in Exhibit 2, in almost half of the rolling 10-year periods, we observe one negative premium out of four premiums. However, the premiums do not move in lockstep, so there were fewer instances of two negative premiums and no instances of three or four negative premiums.
EXHIBIT 2
One Negative Premium Is Not Uncommon
Number and percentage of rolling 10-year periods with negative premiums, US market, July 1963–December 2022
Past performance is not a guarantee of future results. Actual returns may be lower.
In all likelihood, any premium that doesn’t materialise will get called into question.
Plenty of ink will be spilled scrutinising the one that had the bad draw, even if that’s all it was. The value premium has been under the microscope lately, but the other premiums have had their turns historically.
From an empirical perspective, a negative 10-year premium is not so far outside the range of outcomes as to suggest that the premium no longer exists.
More importantly, we have a sensible framework for expecting positive size, value and profitability premiums. That framework is valuation theory, which posits that a stock’s price reflects the company’s expected future cash flows discounted to present value.
The discount rate equals an investor’s expected return. Therefore, as long as stocks have different expected returns, those with lower prices and higher expected cash flows should have higher expected returns.
This framework holds regardless of whether realised premiums have been positive or negative in the recent past.
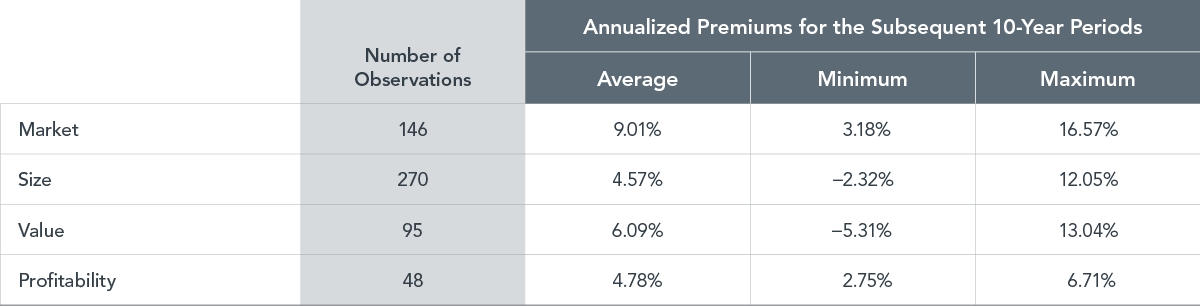
In Exhibit 3, we identify the rolling 10-year periods when a premium was negative and then examine how the premium behaved over the following 10 years.
Our results confirm that premiums have, on average, been positive after periods of underperformance.
While it is certainly disappointing to experience a negative 10-year premium, we believe that investors should avoid extrapolating the past into the next decade and abandoning their investment philosophy at potentially inopportune times.
EXHIBIT 3
Swing Back
Subsequent performance of 10-year premiums following a negative 10-year premium, US market through December 2022
Past performance is not a guarantee of future results. Actual returns may be lower.
Over shorter horizons, the past performance of premiums doesn’t tell us much about future premiums either.
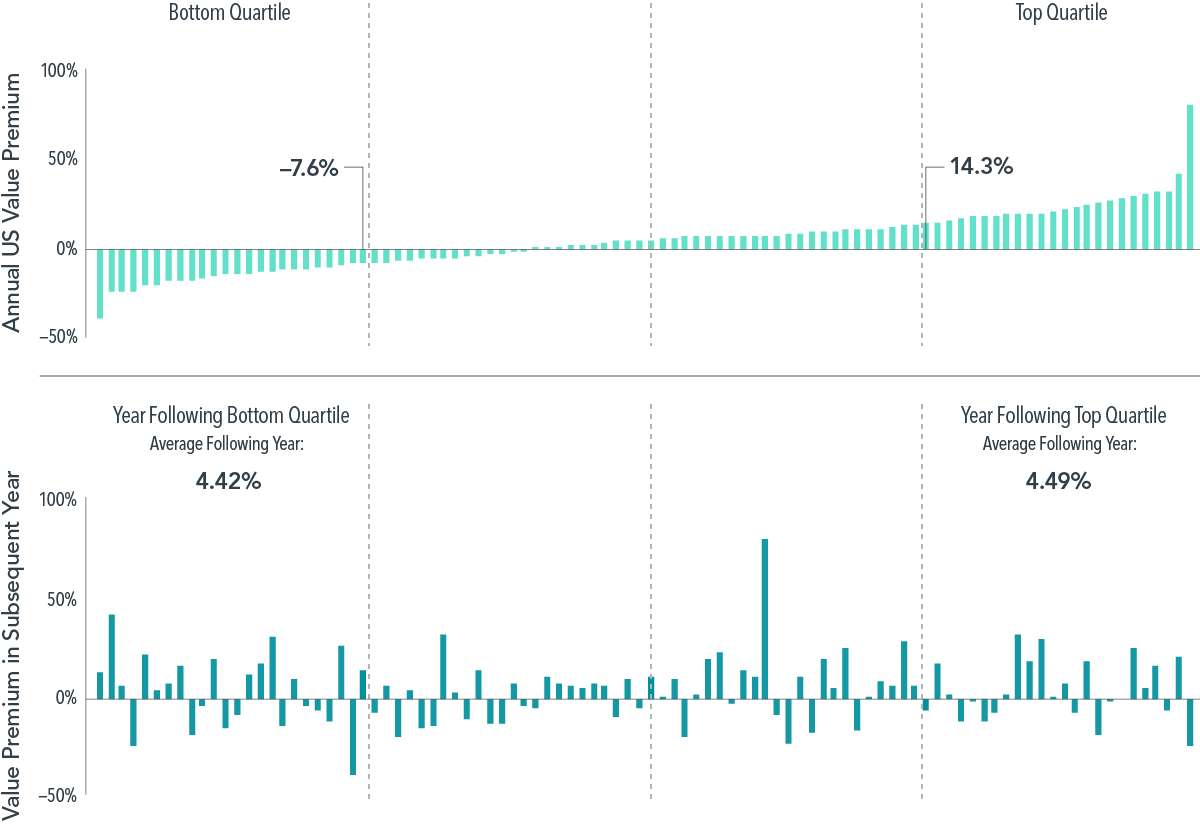
For example, Exhibit 4 examines value’s performance from one calendar year to the next.
Interestingly, the average annual value premium following the top quartile years (those with the strongest value performance) was roughly the same as the value premium in the year following the bottom quartile (the weakest years for the value premium).
So maintaining discipline and resisting the temptation to make changes based on short-term performance can be beneficial. If your goals and risk tolerance haven’t changed, then your asset allocation likely doesn’t need to change.
EXHIBIT 4
Does Value Last Year Tell Us About This Year?
Annual value premiums and subsequent-year value premiums, US market, 1927-2022
Past performance is not a guarantee of future results. Actual returns may be lower.
Furthermore, premiums can materialise quickly, so you want to be properly positioned to capture the returns when they show up.
The period leading up to and shortly after the start of the 21st century provides an extreme, albeit anecdotal, example.
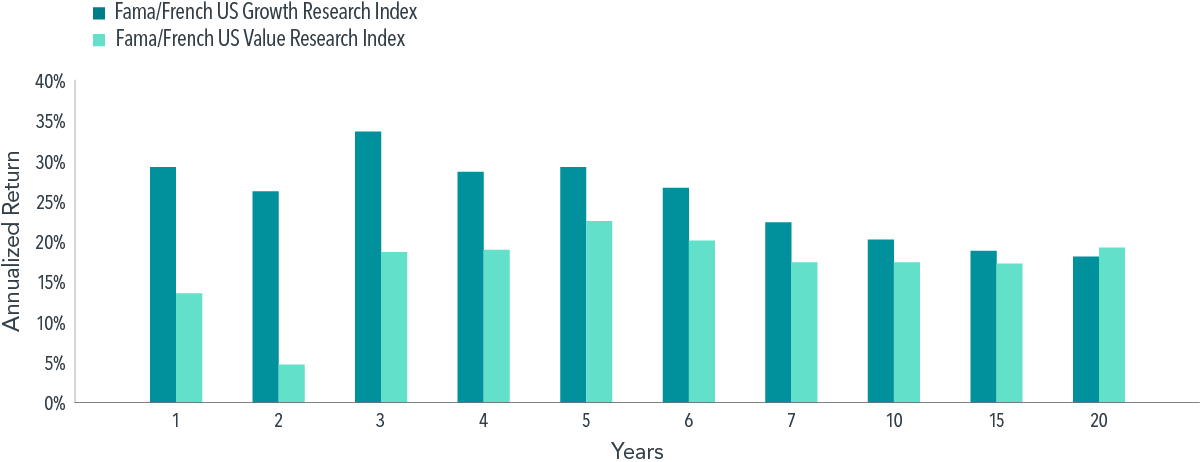
Exhibit 5 Panel A shows the performance of the Fama/French US Growth and US Value Research indices. Growth beat value over most trailing periods from one to 20 years ending March 31, 2000.
Consequently, many investors found themselves questioning a value strategy, meaning they wondered whether expected returns were still related to the price paid for a stock in the so-called “new economy”.
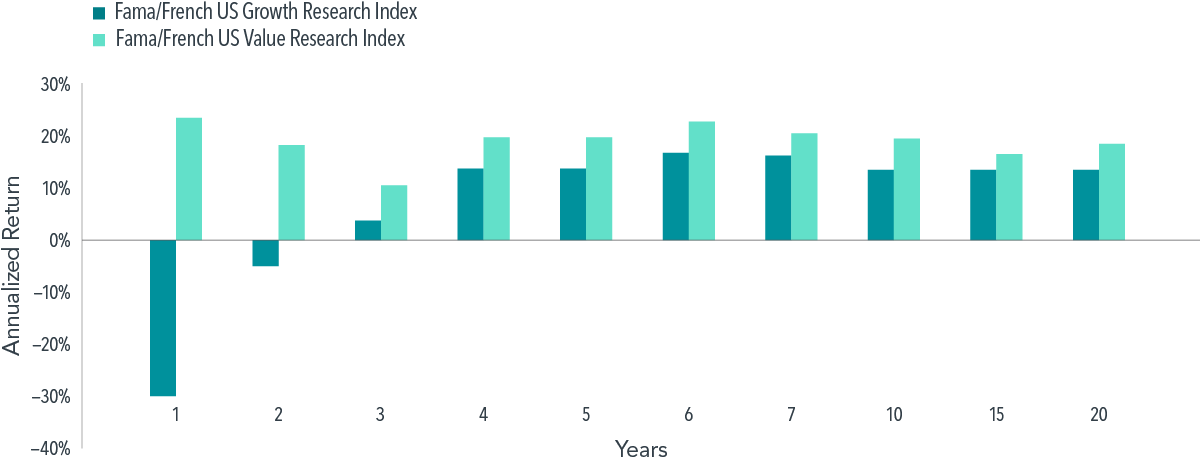
Investors who capitulated to this line of reasoning may have regretted their decision a mere 12 months later, because the value index strongly outperformed the growth index over every trailing period from one to 20 years ending March 31, 2001. This is illustrated in Exhibit 5 Panel B.
The moral of the story? Negative outcomes are disappointing, but investors should view them with the proper perspective and stay the course.
EXHIBIT 5
Premiums Can Materialise Quickly
Panel A: Trailing periods ending March 31, 2000
Panel B: Trailing periods ending March 31, 2001
Past performance is not a guarantee of future results. Actual returns may be lower.
Appendix
Fama/French Total US Market Research Index: 1926 – Present: Fama/French Total US Market Research Factor + One-Month US Treasury Bills. Source: Ken French Website.
Fama/French US Value Research Index: Provided by Fama/French from CRSP securities data. Includes the lower 30% in price-to-book of NYSE securities (plus NYSE Amex equivalents since July 1962 and Nasdaq equivalents since 1973).
Fama/French US Growth Research Index: Provided by Fama/French from CRSP securities data. Includes the higher 30% in price-to-book of NYSE securities (plus NYSE Amex equivalents since July 1962 and Nasdaq equivalents since 1973).
Dimensional US Small Cap Index: Created by Dimensional in March 2007 and compiled by Dimensional. It represents a market-capitalisation-weighted index of securities of the smallest US companies whose market capitalisation falls in the lowest 8% of the total market capitalisation of the eligible market. The eligible market is composed of securities of US companies traded on the NYSE, NYSE MKT (formerly AMEX), and Nasdaq Global Market. Exclusions: Non-US companies, REITs, UITs, and investment companies. From January 1975 to the present, the index also excludes companies with the lowest profitability and highest relative price within the small cap universe. Profitability is measured as operating income before depreciation and amortisation minus interest expense scaled by book. Source: CRSP and Compustat. The index monthly returns are computed as the simple average of the monthly returns of 12 subindices, each one reconstituted once a year at the end of a different month of the year. The calculation methodology for the Dimensional US Small Cap Index was amended on January 1, 2014, to include profitability as a factor in selecting securities for inclusion in the index.
Fama/French US High Profitability Index: Courtesy of Fama/French from CRSP and Compustat securities data. Includes all stocks in the upper 30% operating profitability range of NYSE eligible firms; rebalanced annually in June. OP for June of year t is annual revenues minus cost of goods sold, interest expense, and selling, general, and administrative expenses divided by book equity for the last fiscal year end in t–1.
Fama/French US Low Profitability Index: July 1963–Present: Courtesy of Fama/French from CRSP and Compustat securities data. Includes all stocks in the lower 30% operating profitability range of NYSE eligible firms; rebalanced annually in June. OP for June of year t is annual revenues minus cost of goods sold, interest expense, and selling, general, and administrative expenses divided by book equity for the last fiscal year end in t–1.
The Dimensional and Fama/French indices reflected above are not “financial indices” for the purpose of the EU Markets in Financial Instruments Directive (MiFID). Rather, they represent academic concepts that may be relevant or informative about portfolio construction and are not available for direct investment or for use as a benchmark.
The Dimensional indices have been retrospectively calculated by Dimensional Fund Advisors LP and did not exist prior to their index inception dates. Accordingly, results shown during the periods prior to each index’s inception date do not represent actual returns of the index. Other periods selected may have different results, including losses. Backtested index performance is hypothetical and is provided for informational purposes only to indicate historical performance had the index been calculated over the relevant time periods. Backtested performance results assume the reinvestment of dividends and capital gains.
Regarding the Fama/French indices: Results shown during periods prior to each index’s inception date do not represent actual returns of the respective index. Other periods selected may have different results, including losses. Backtested index performance is hypothetical and is provided for informational purposes only to indicate historical performance had the index been calculated over the relevant time periods. Backtested performance results assume the reinvestment of dividends and capital gains.
Glossary
Market premium: The return difference between stocks and short-term Treasury bills.
Size premium: The return difference between small capitalisation stocks and large capitalisation stocks.
Value premium: The return difference between stocks with low relative prices (value) and stocks with high relative prices (growth).
Profitability premium: The return difference between stocks of companies with high profitability over those with low profitability.
Footnotes
1 The performance of small caps vs. large caps is based on the Dimensional US Small Cap Index vs. the S&P 500, the Dimensional International Small Cap Index vs. the MSCI World ex USA Index, and the Dimensional Emerging Markets Small Cap Index vs. the MSCI Emerging Markets Index. The performance of higher-profitability stocks vs. lower-profitability stocks is based on the Fama/French high-profitability indices vs. the Fama/French low-profitability indices in the US, developed ex US markets, and emerging markets. See the Appendix for descriptions of the Dimensional and Fama/French indices.
2 Wiebke Lamping and Namiko Saito, “Proof in Practice: Applying Profitability Research to Real-World Solutions”, research paper, Dimensional Fund Advisors, August 2023.
3 Wes Crill, “,” Insights (blog), Dimensional Fund Advisors, August 2022.
Disclosures
Eugene Fama and Ken French are members of the Board of Directors of the general partner of, and provide consulting services to, Dimensional Fund Advisors LP.
The information in this material is intended for the recipient’s background information and use only. It is provided in good faith and without any warranty or representation as to accuracy or completeness. Information and opinions presented in this material have been obtained or derived from sources believed by Dimensional to be reliable, and Dimensional has reasonable grounds to believe that all factual information herein is true as at the date of this material. It does not constitute investment advice, a recommendation, or an offer of any services or products for sale and is not intended to provide a sufficient basis on which to make an investment decision. Before acting on any information in this document, you should consider whether it is appropriate for your particular circumstances and, if appropriate, seek professional advice. It is the responsibility of any persons wishing to make a purchase to inform themselves of and observe all applicable laws and regulations. Unauthorized reproduction or transmission of this material is strictly prohibited. Dimensional accepts no responsibility for loss arising from the use of the information contained herein.
This material is not directed at any person in any jurisdiction where the availability of this material is prohibited or would subject Dimensional or its products or services to any registration, licensing, or other such legal requirements within the jurisdiction.
“Dimensional” refers to the Dimensional separate but affiliated entities generally, rather than to one particular entity. These entities are Dimensional Fund Advisors LP, Dimensional Fund Advisors Ltd., Dimensional Ireland Limited, DFA Australia Limited, Dimensional Fund Advisors Canada ULC, Dimensional Fund Advisors Pte. Ltd., Dimensional Japan Ltd., and Dimensional Hong Kong Limited. Dimensional Hong Kong Limited is licensed by the Securities and Futures Commission to conduct Type 1 (dealing in securities) regulated activities only and does not provide asset management services.
Risks
Investments involve risks. The investment return and principal value of an investment may fluctuate so that an investor’s shares, when redeemed, may be worth more or less than their original value. Past performance is not a guarantee of future results. There is no guarantee strategies will be successful.
This material is issued by DFA Australia Limited (AFS License No. 238093, ABN 46 065 937 671). This material is provided for information only. No account has been taken of the objectives, financial situation or needs of any particular person. Accordingly, to the extent this material constitutes general financial product advice, investors should, before acting on the advice, consider the appropriateness of the advice, having regard to the investor’s objectives, financial situation and needs. Investors should also consider the Product Disclosure Statement (PDS) and the target market determination (TMD) that have been made for each financial product either issued or distributed by DFA Australia Limited prior to acquiring or continuing to hold any investment. Go to dimensional.com/funds to access a copy of the PDS or the relevant TMD. Any opinions expressed in this material reflect our judgement at the date of publication and are subject to change.