
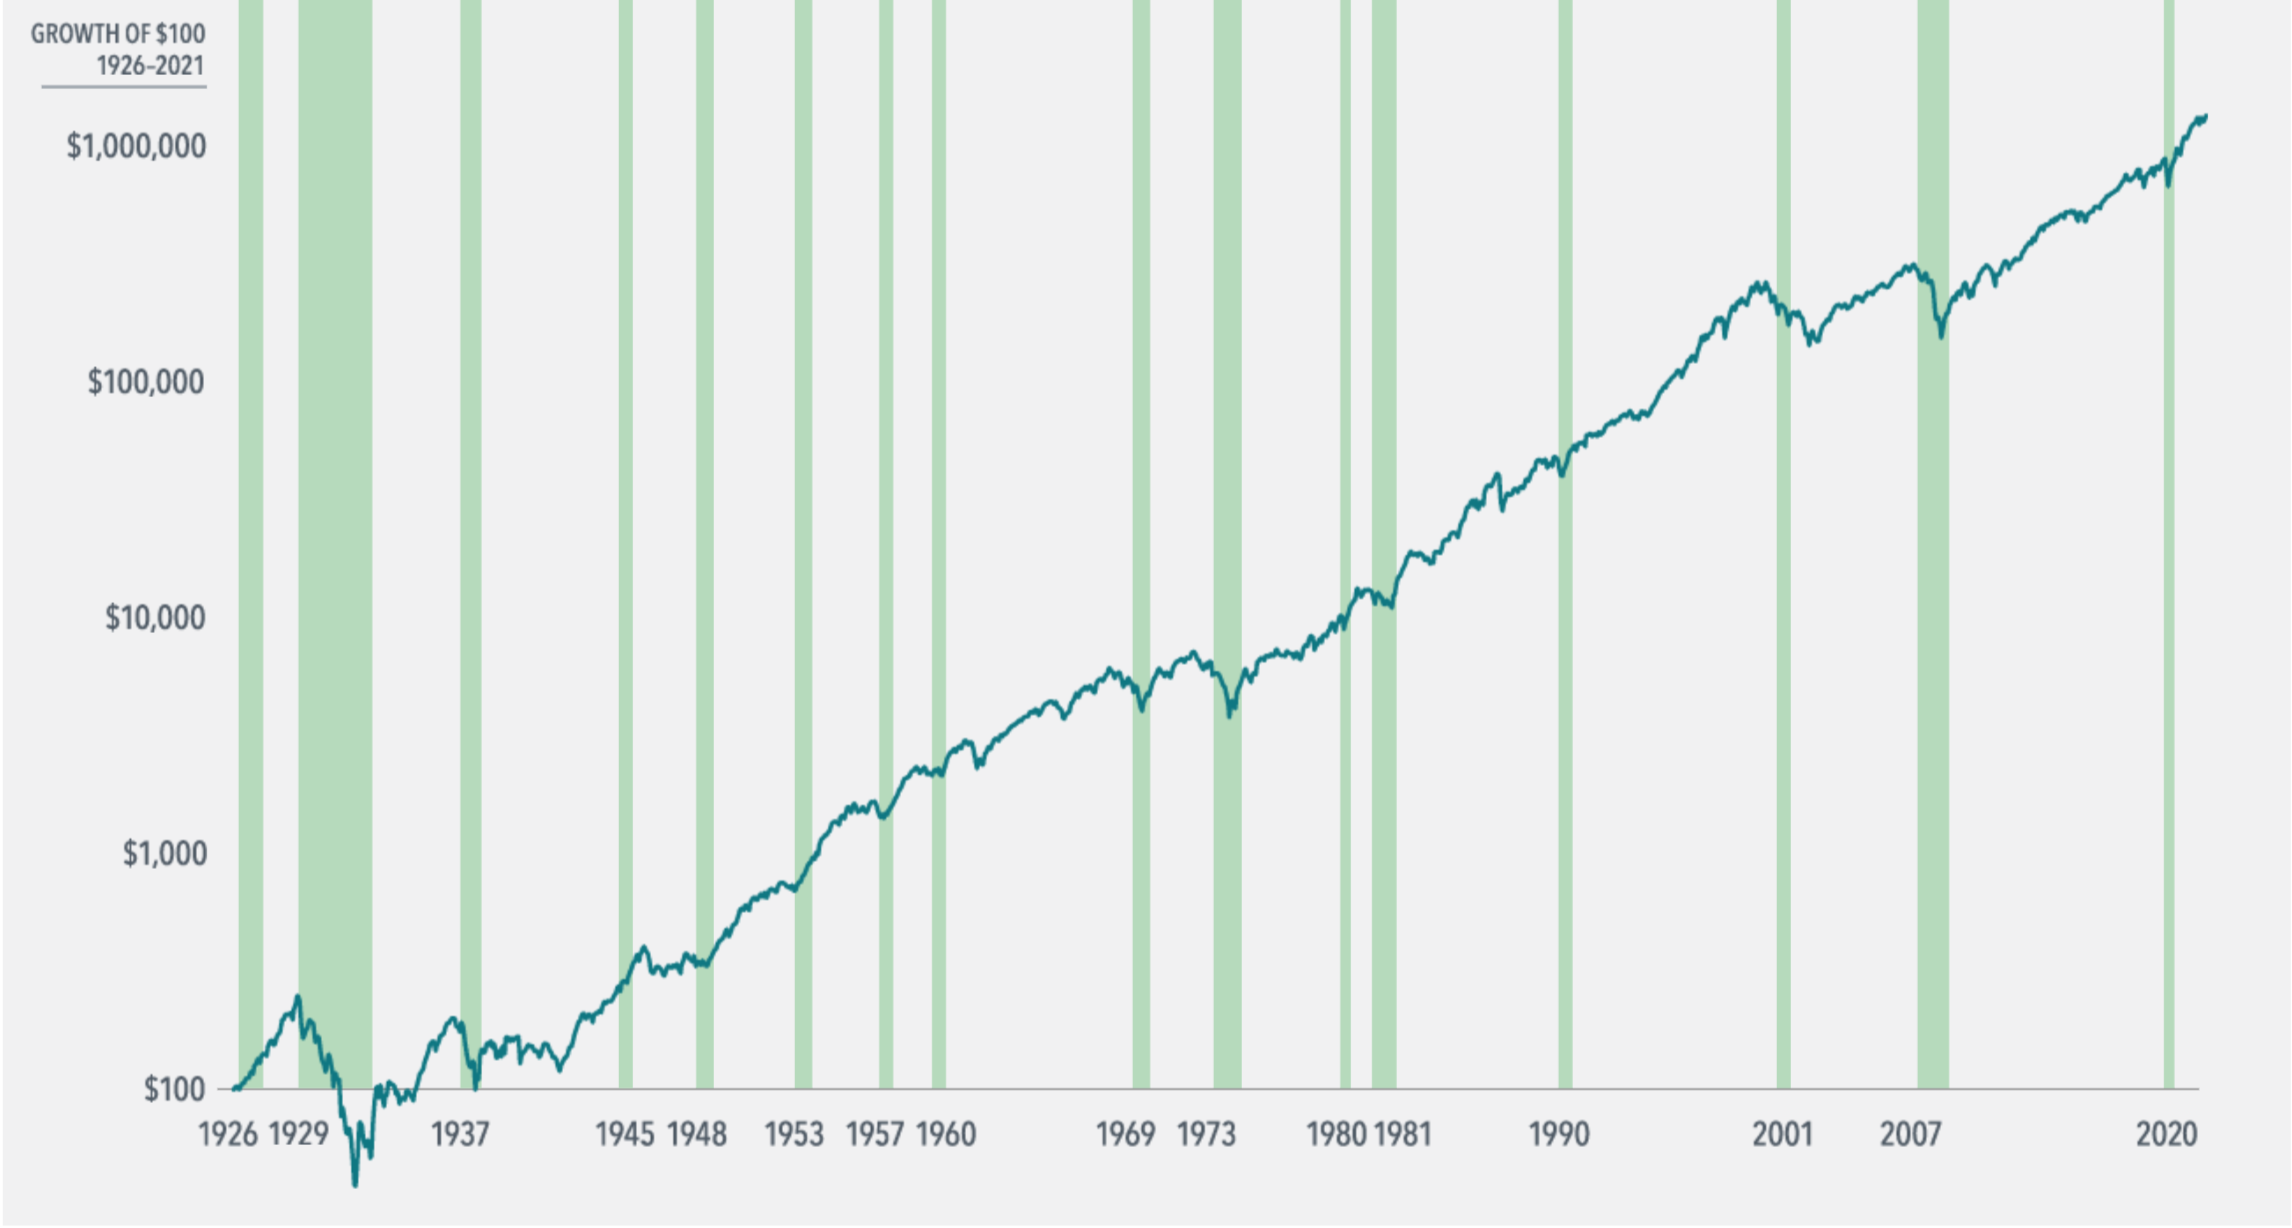
What does a century of economic cycles teach investors about investing? The following graphs examine how stocks have behaved during US economic downturns.
Markets around the world have often rewarded investors even when economic activity has slowed. This is an important lesson on the forward-looking nature of markets, highlighting how current market prices reflect market participants’ collective expectations for the future.
The shaded green periods below represent the last 100 years of recessions.
Past performance is no guarantee of future results. Investing risks include loss of principal and fluctuating value. There is no guarantee an investment strategy will be successful.
Indices are not available for direct investment. Their performance does not reflect the expenses associated with the management of an actual portfolio.
1926—1927
A few years before the Depression, the US experienced a mild, yearlong recession accompanied by a minor bout of deflation. The stock market slipped 2.9% in the first month of the downturn.

Great Depression
The Depression decimated the US economy – unemployment climbed to 25.2%, and industrial production plunged 48.6%. Before the collapse ended, stocks collectively lost 83.6% in a 33-month market downturn.

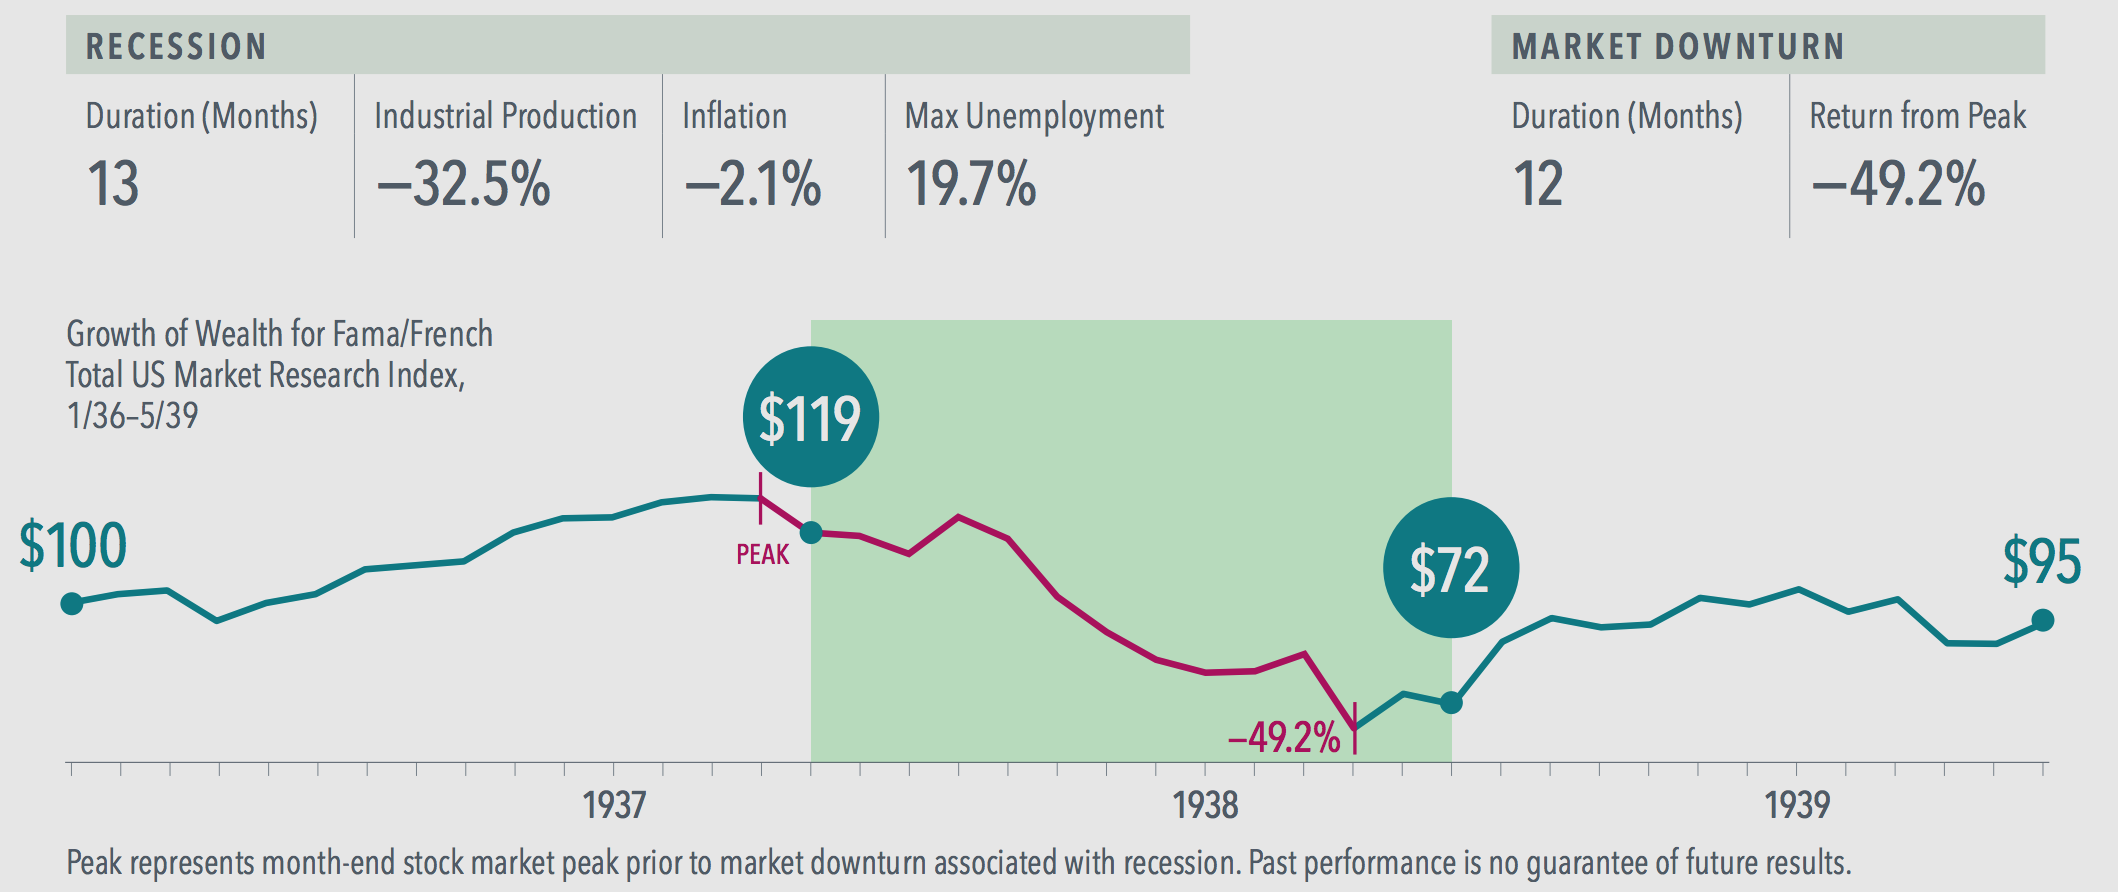
1937—1938
A sharp, 13-month recession – marked by high unemployment and a big dip in industrial production – occurred in the midst of the nation’s recovery from the Depression. Stock market investors suffered a 49.2% loss.
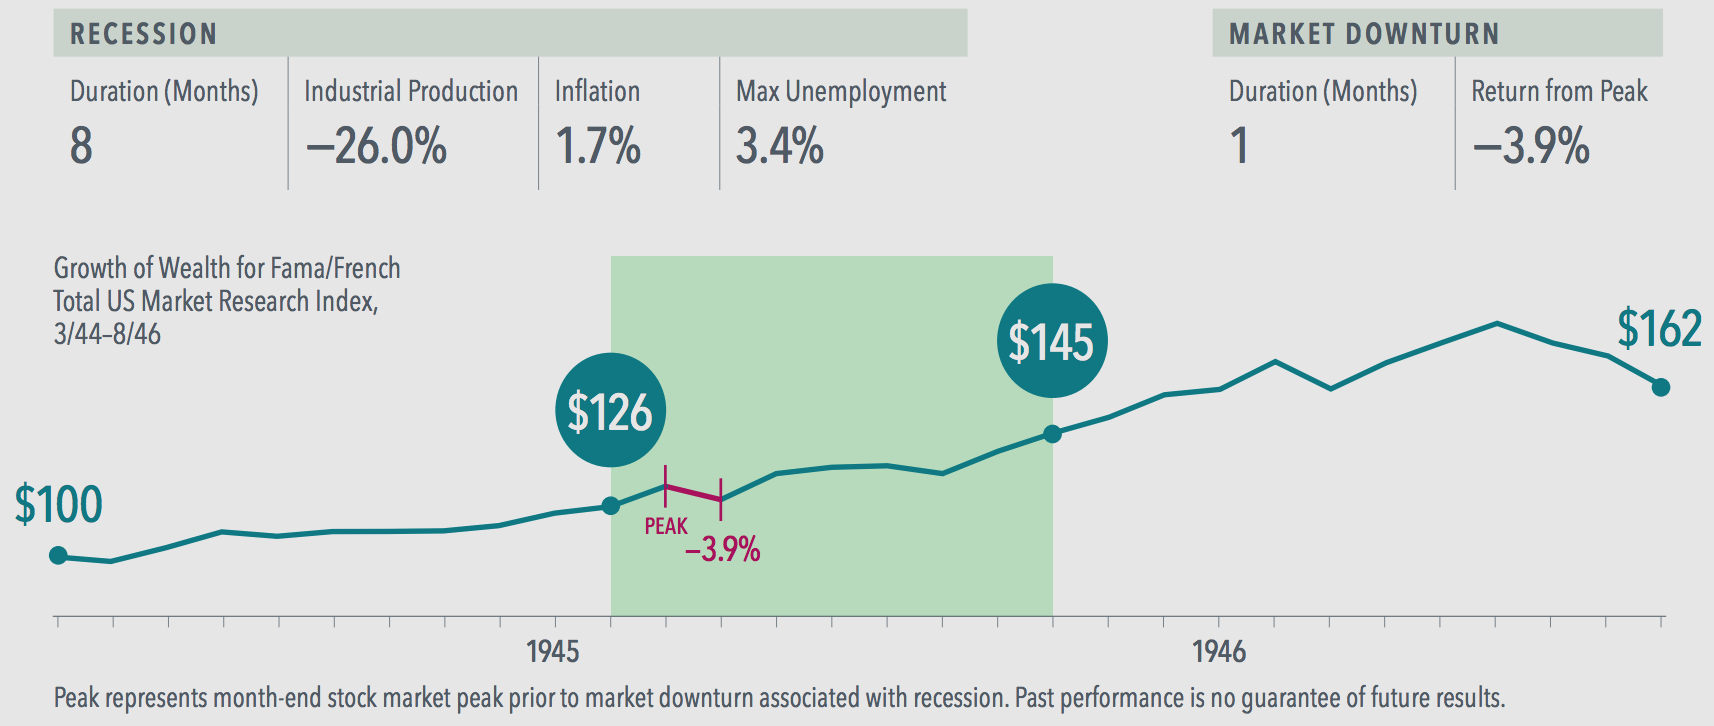
World War II Recession
Industrial production plunged 26% during the eight-month recession near the end of World War II. But the stock market dipped only 3.9% early in the recession before rebounding.
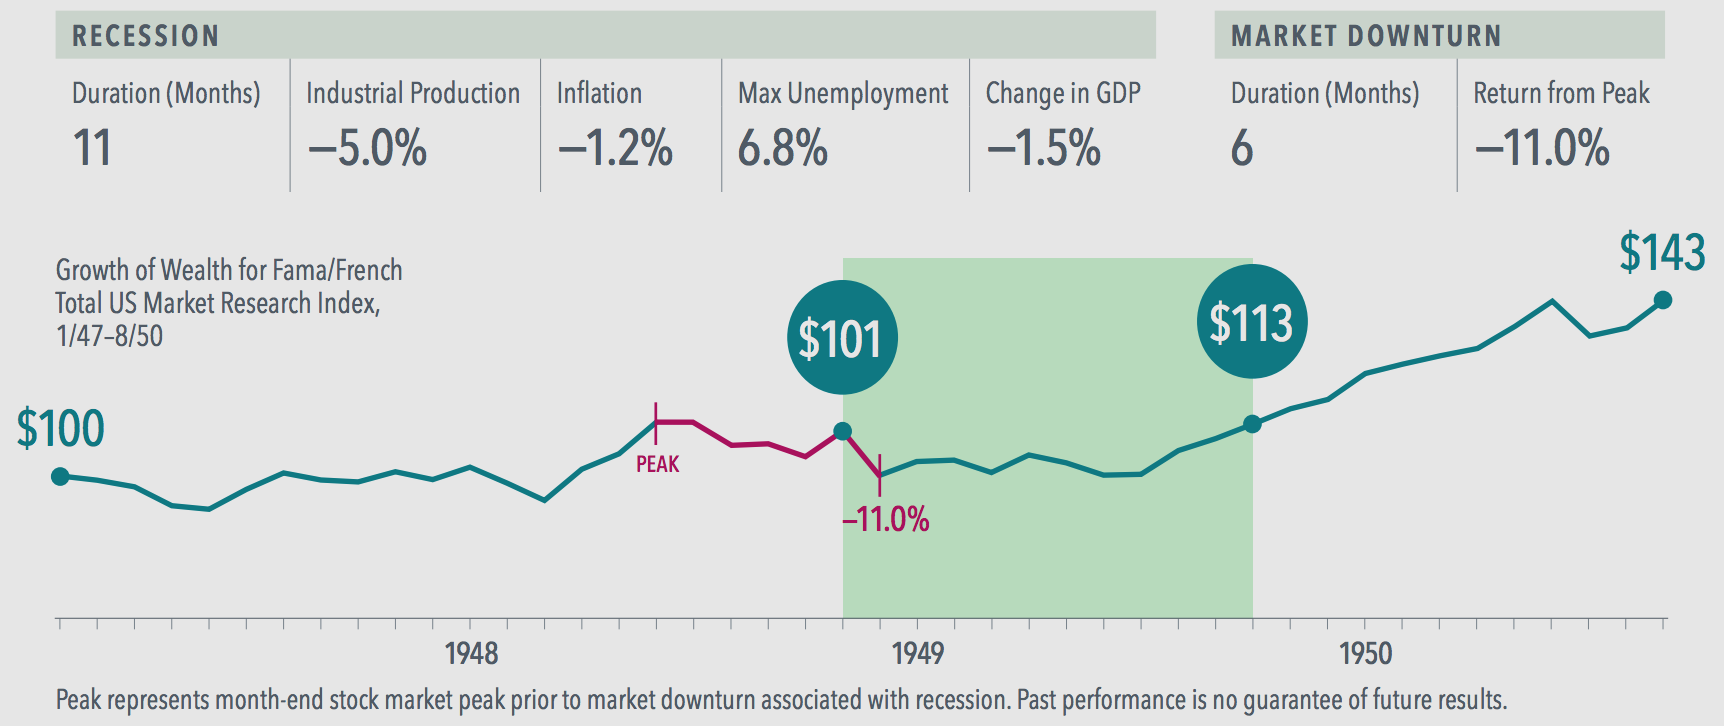
1948—1949
A modest stock market slide of -11.0% began five months before this relatively small economic downturn that occurred a few years after the war.
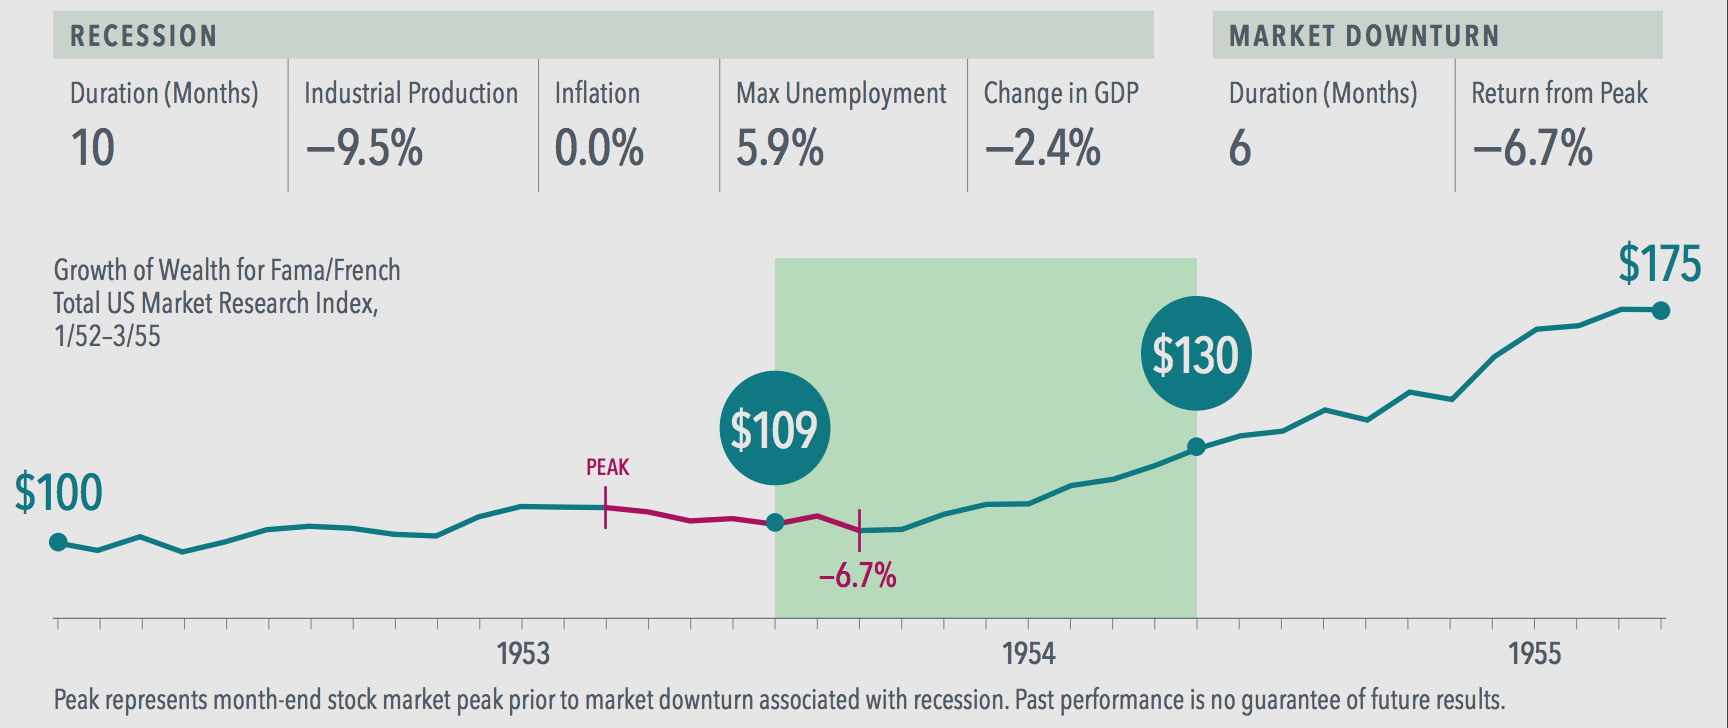
1953—1954
The Korean Armistice was signed in the summer of 1953. A stock market slump that had begun in March was over by August, but the recession continued until early 1954.
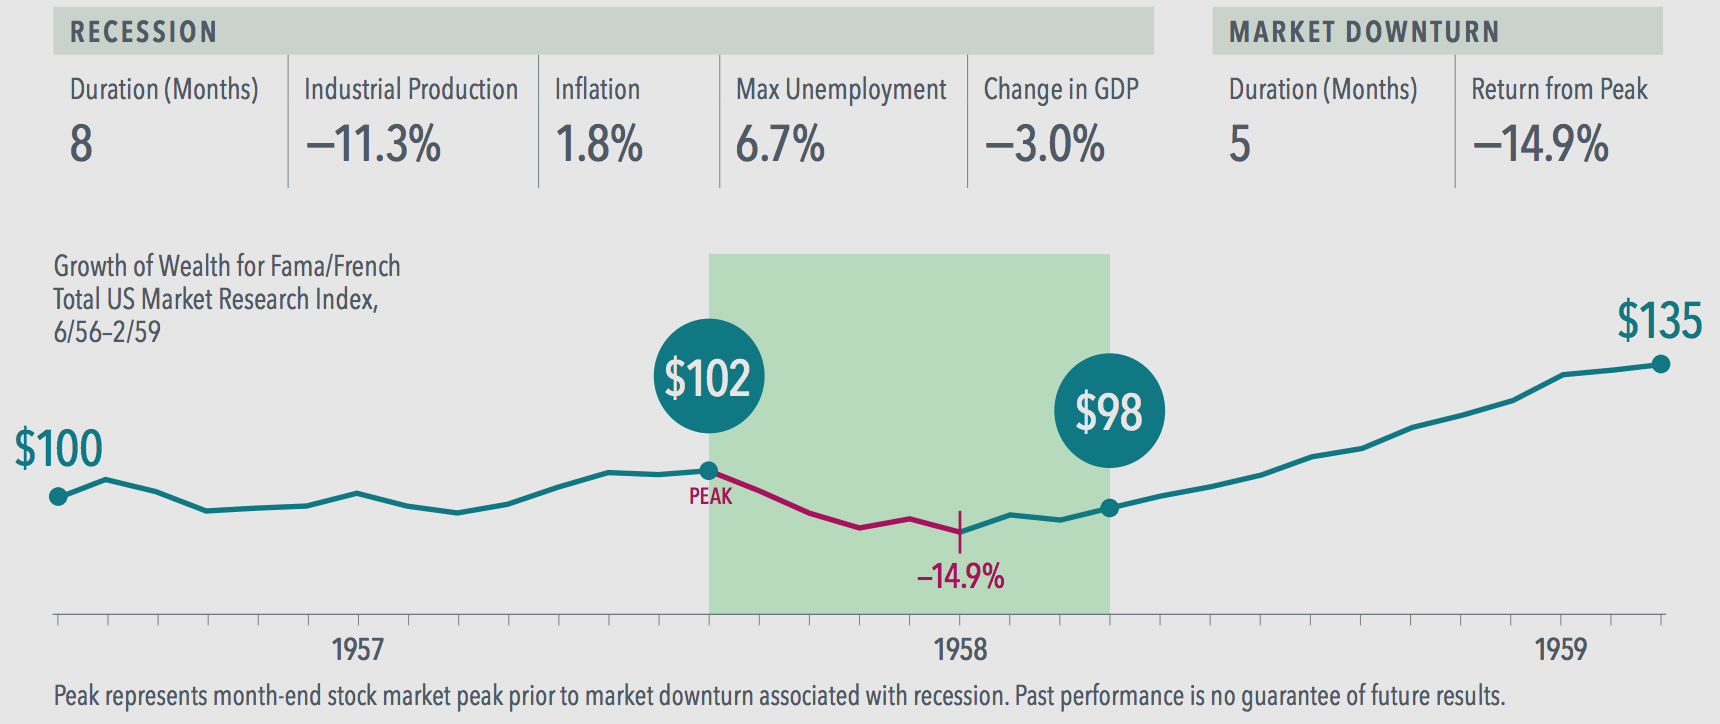
1957—1958
A huge drop in industrial production of –11.3% and a contraction in GDP of –3% interrupted the 1950s boom. Stocks retrenched 14.9% in the midst of a decade-long climb.
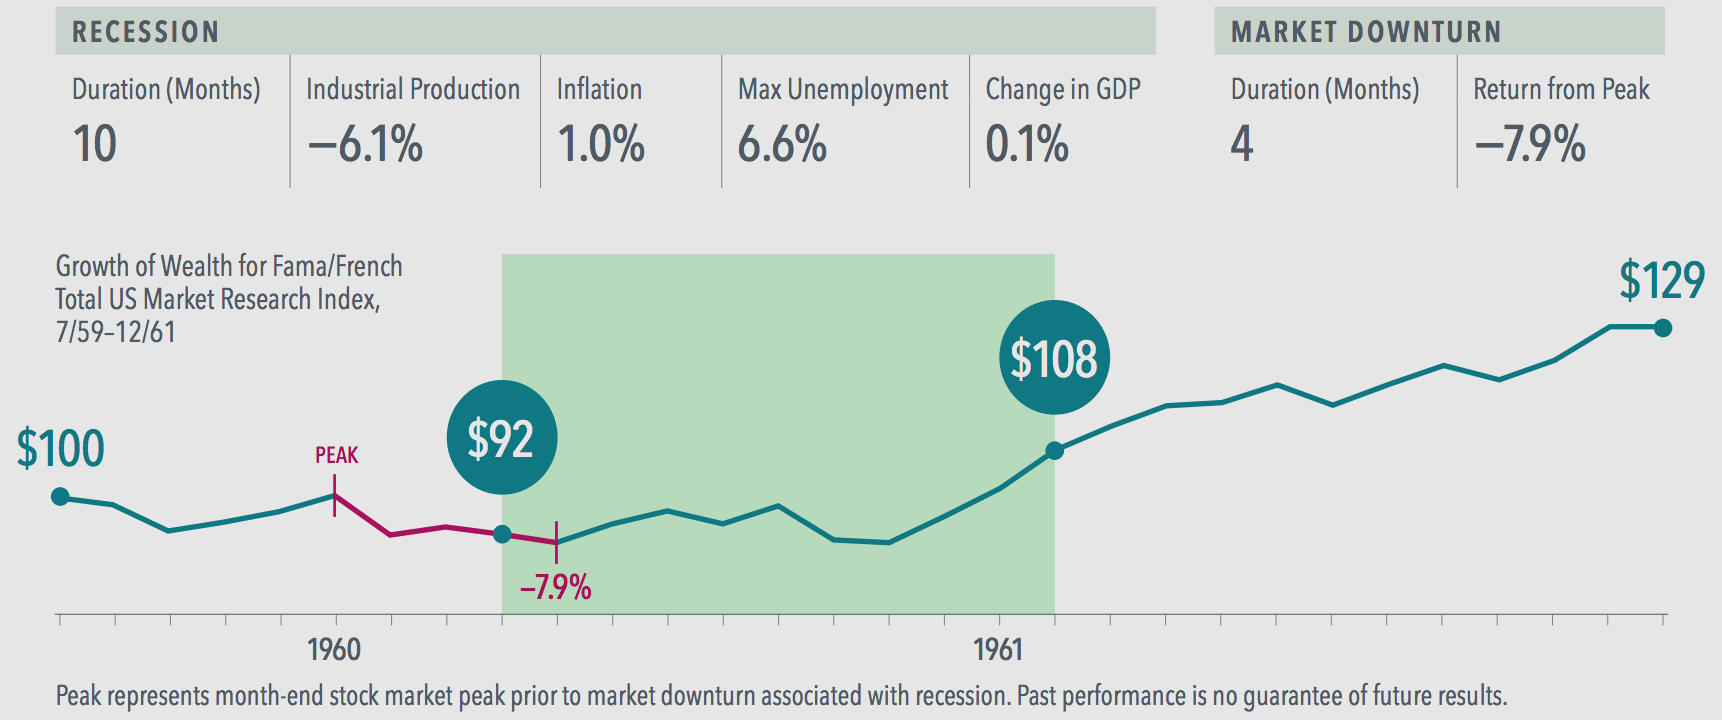
1960—1961
This four-month pause followed the previous decade’s bull market. In the election year of 1960, unemployment rose to 6.6%, and the stock market dropped 7.9%.
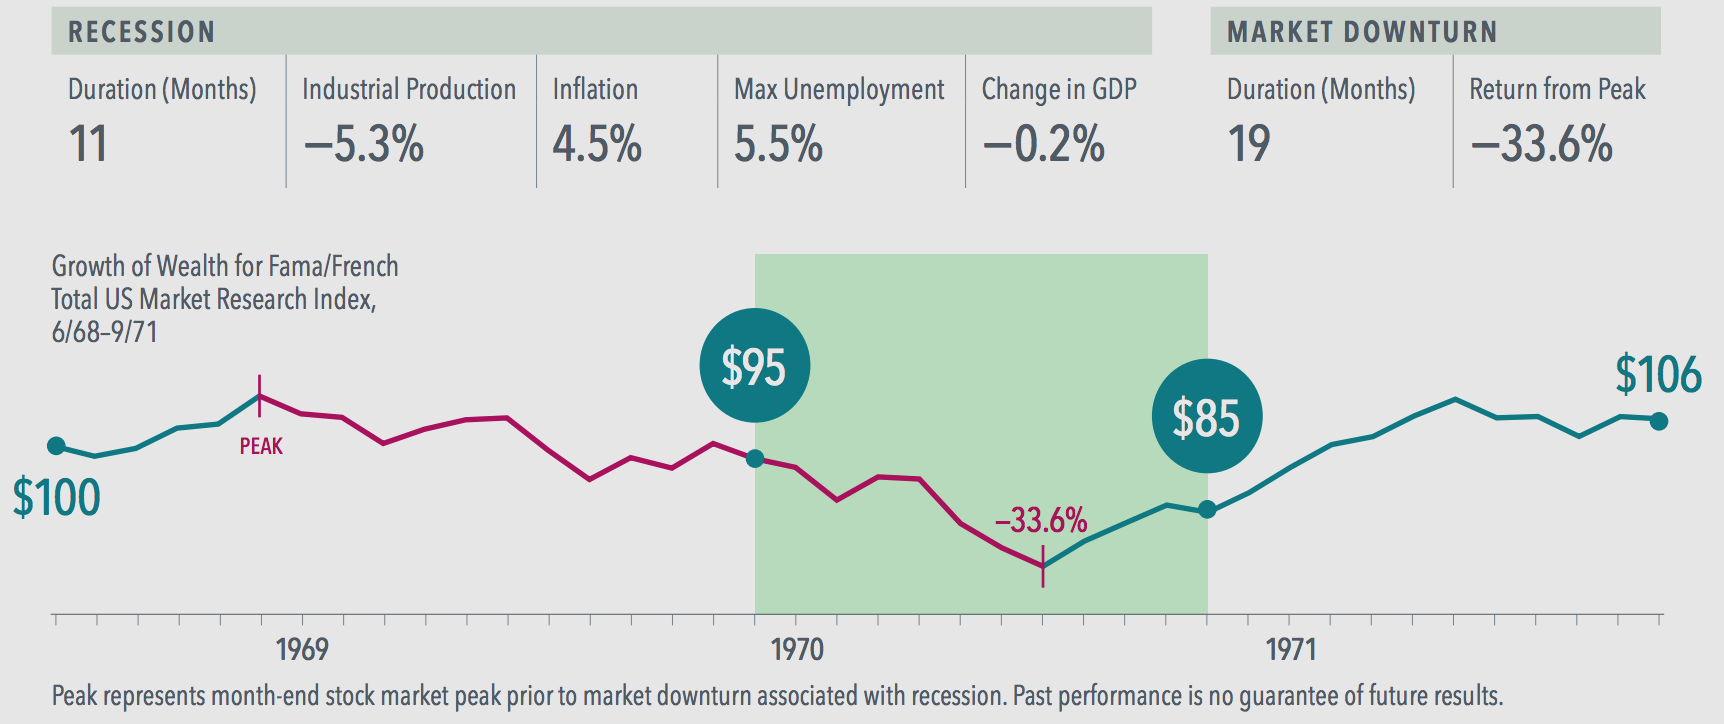
1969—1970
High inflation and a big jump in unemployment punctuated the 11-month recession that began in December 1969. A volatile stock market eventually lost 33.6% over 19 months.
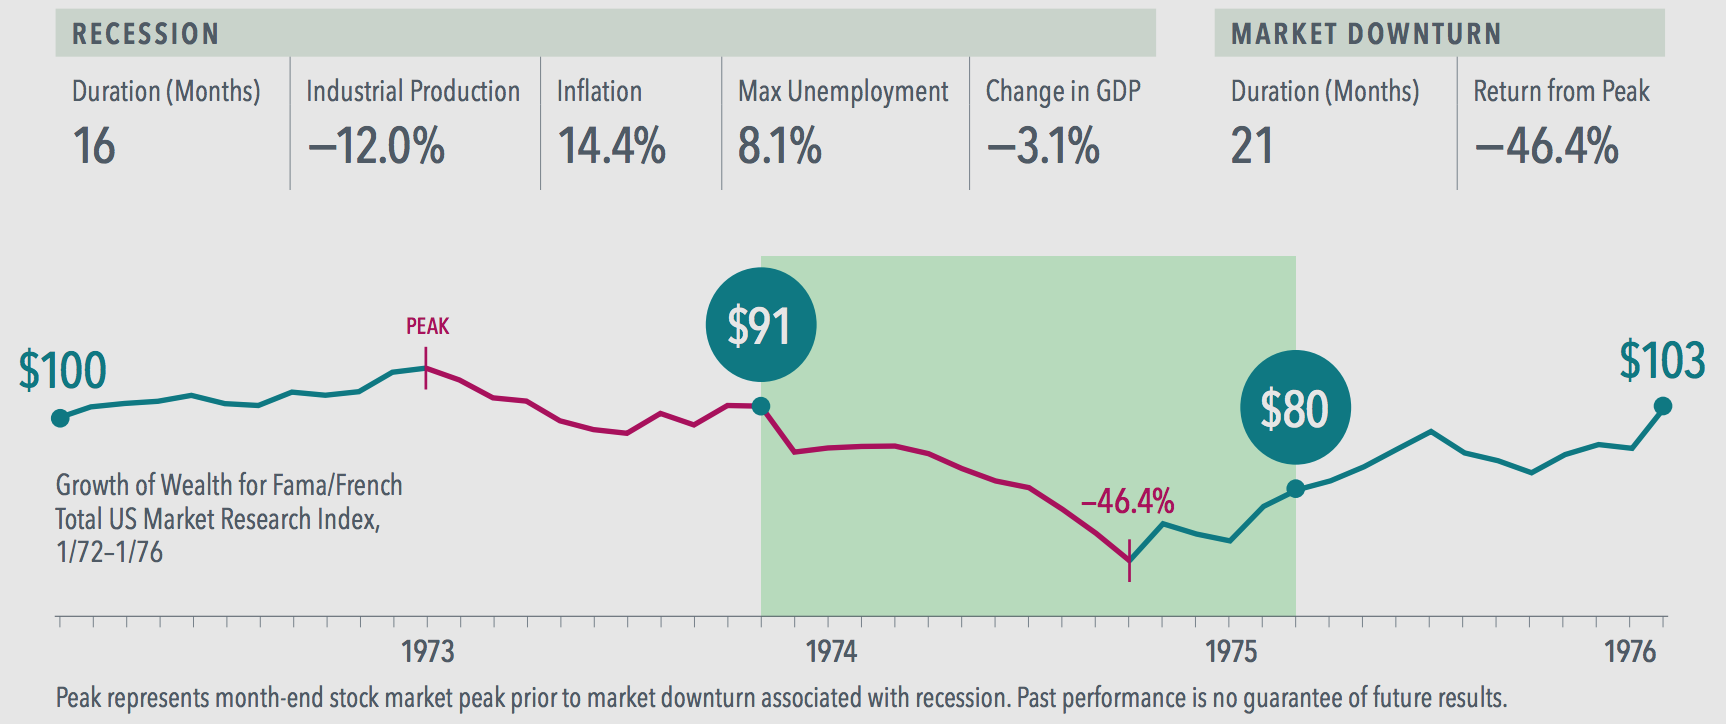
Oil Crisis
Inflation hit double digits during the 1973–75 recession. The stock market lost nearly half its value in the first 11 months of the 16-month economic downturn.
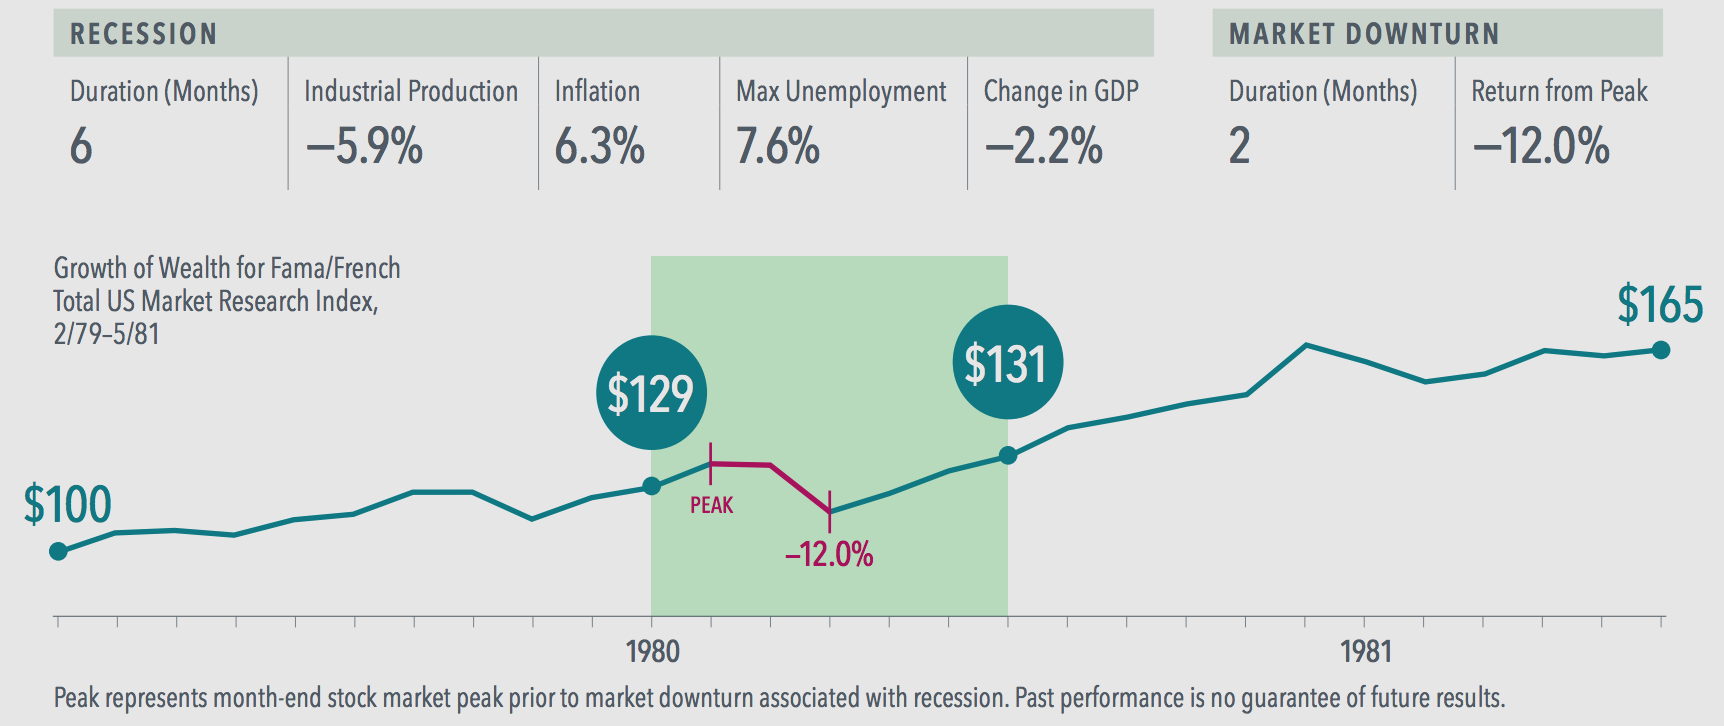
1980
A 12% stock market decline occurred early in 1980’s six-month recession, during which unemployment hit 7.6%. But the market finished the year with an impressive gain of 33.4%.
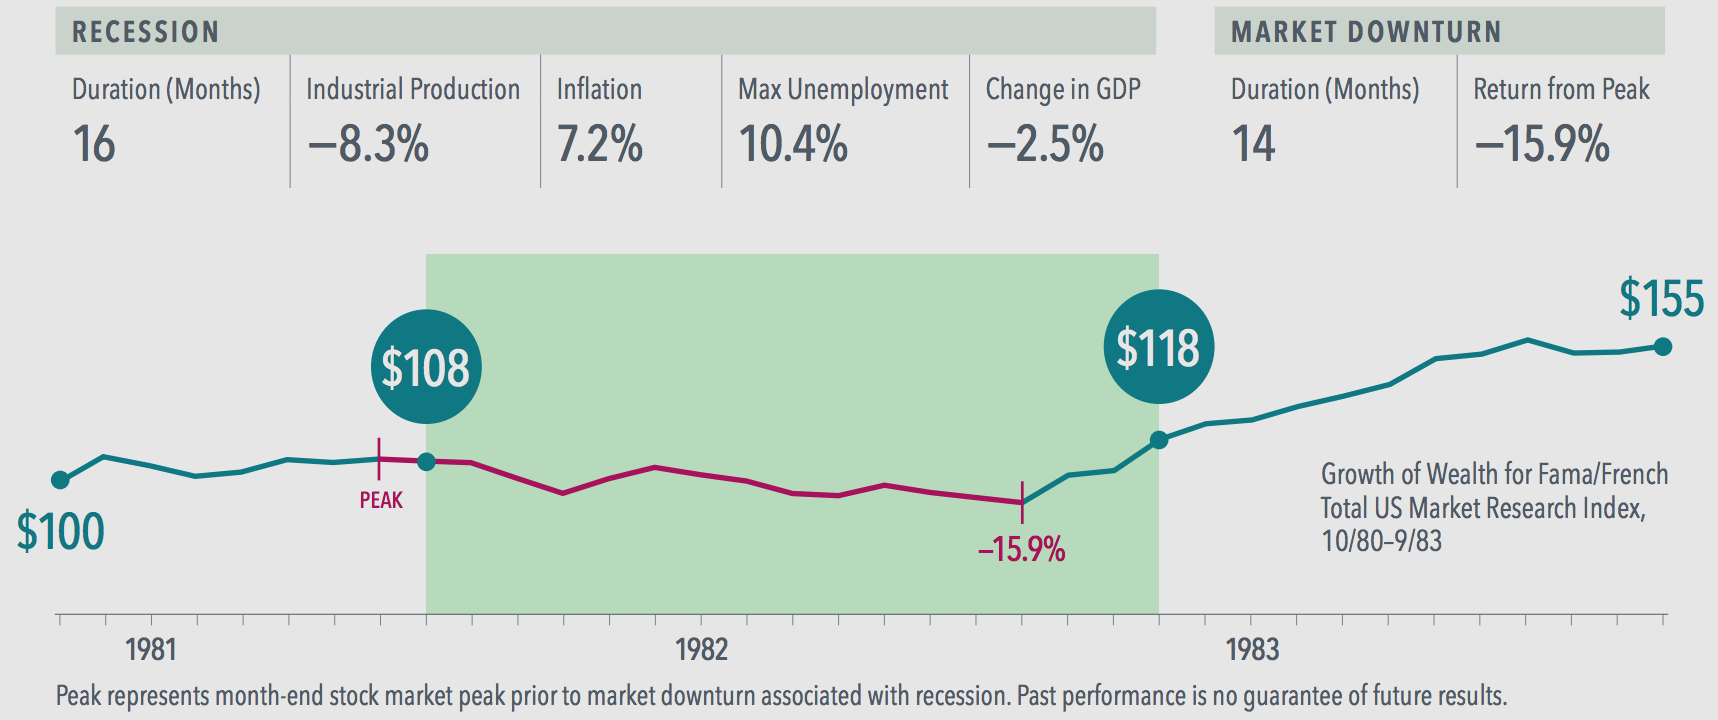
1981–1982
Historically high interest rates preceded a harsh recession that dragged on for 16 months and saw unemployment peak at 10.4%. The stock market experienced a 15.9% slide before beginning a long rally.
Gulf War
Stocks reacted negatively to the onset of the Gulf War in August 1990, dropping 17% over five months as the price of oil doubled. When the market regained its footing, stocks were set to start a nine-year bull market that peaked in the dot-com era.

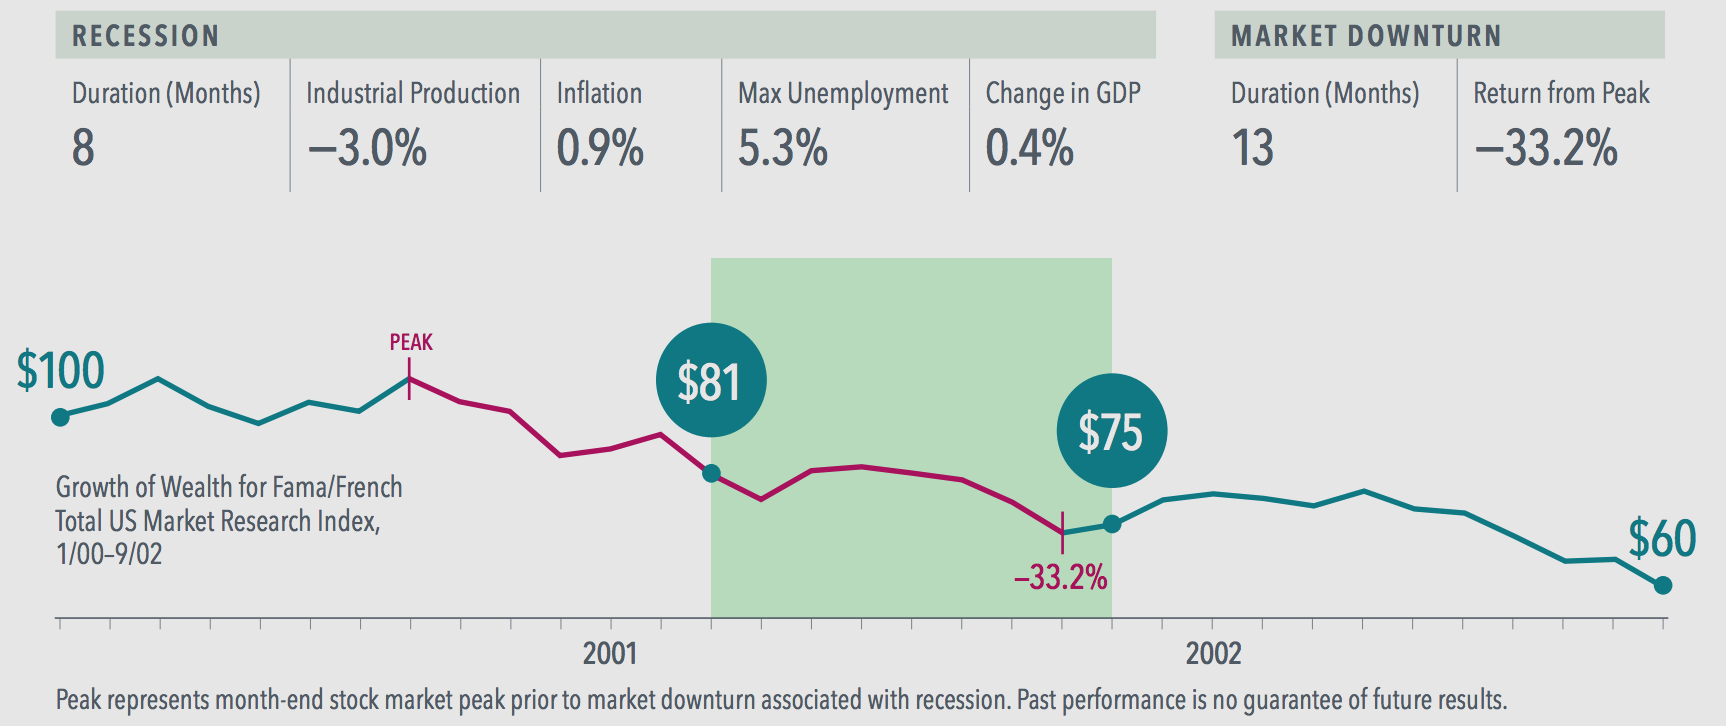
Tech Boom and Bust
Many investors may not realise that the stock market had started a deep decline before the relatively mild recession in March 2001, which followed the tech boom.
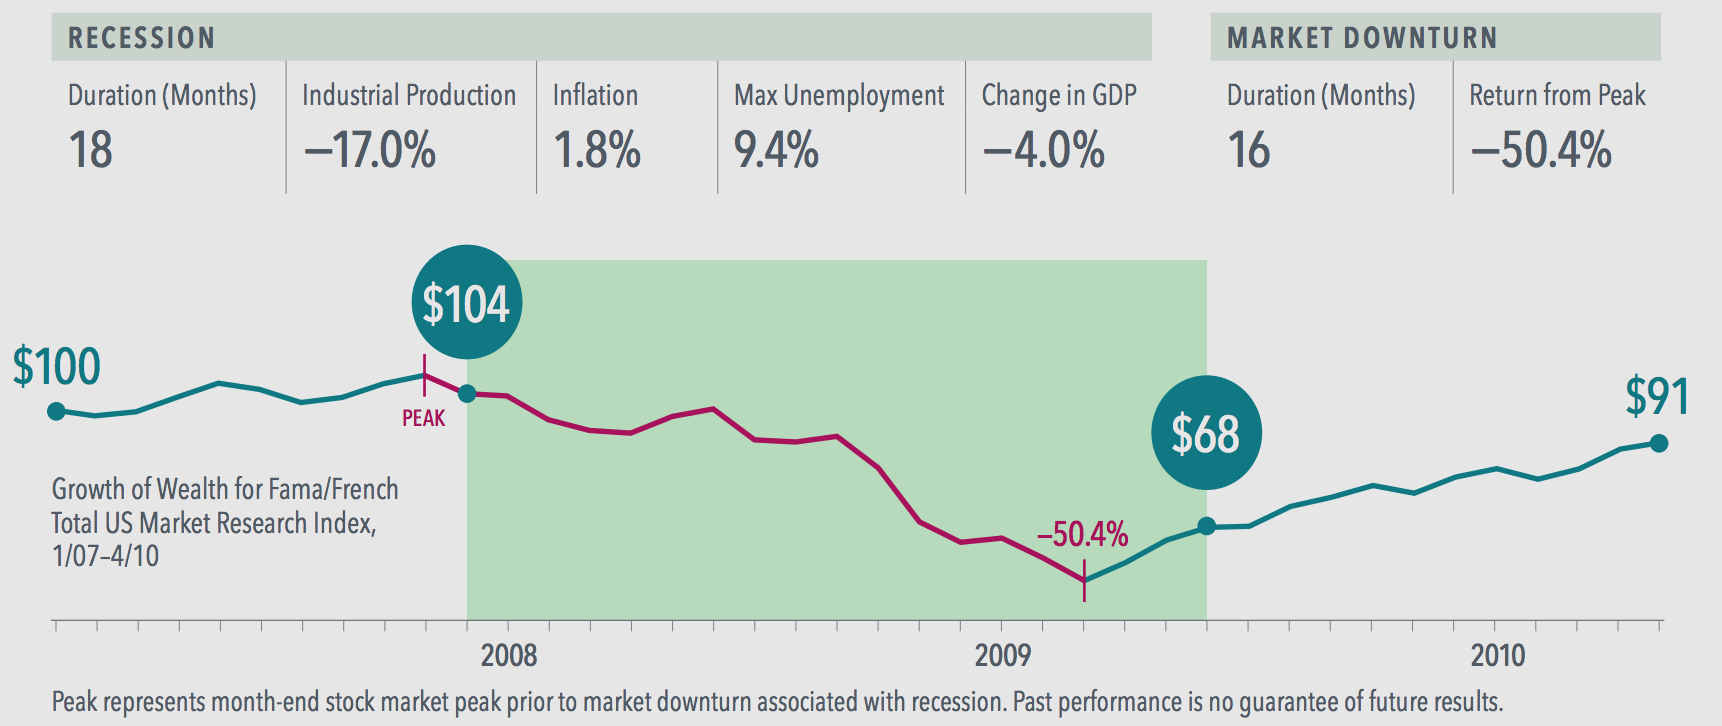
Global Financial Crisis
During the Global Financial Crisis, the worst of the 50.4% stock market dive happened in the latter half of an 18-month recession that saw unemployment hit 9.4% and industrial production tumble 17%. But after falling for 16 months, the market started a nearly 11-year bull run.
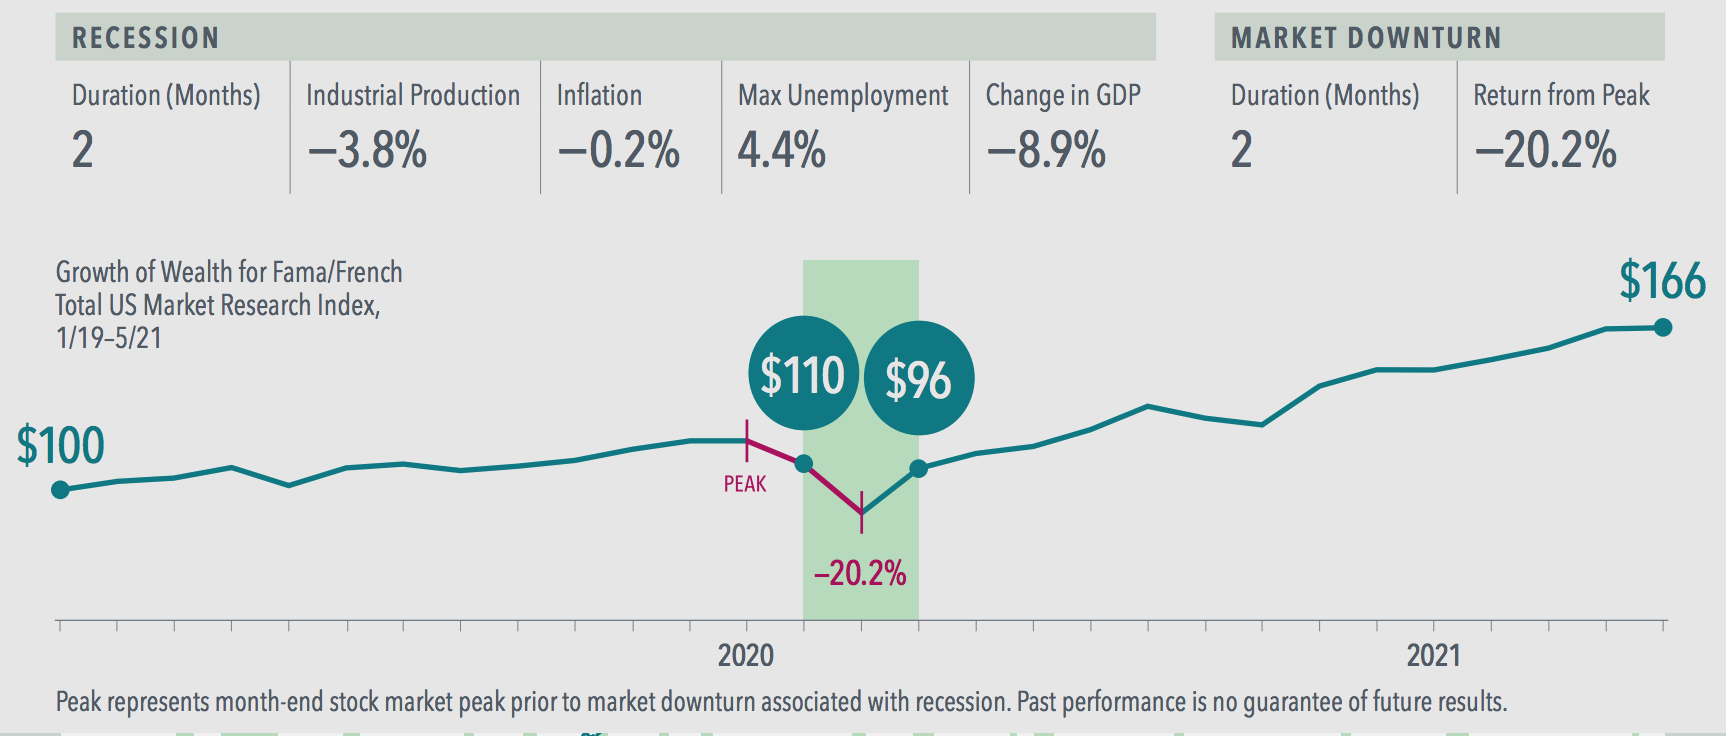
COVID-19
The shortest recession in the past 100 years – and the deepest decline in GDP (–8.9%) since World War II – occurred in early 2020. The US stock market tumbled more than 20% as investors priced in the effects of the pandemic. But stocks made a sharp rebound and recorded a 24.1% gain for the year.
Notes and Data Sources:
• In US dollars. Stock returns represented by Fama/French Total US Market Research Index, provided by Ken French and available at mba.tuck.dartmouth.edu/pages/faculty/ ken.french/data_library.html. This value-weighed US market index is constructed every month, using all issues listed on the NYSE, AMEX, or Nasdaq with available outstanding shares and valid prices for that month and the month before. Exclusions: American depositary receipts. Sources: CRSP for value-weighted US market return. Rebalancing: Monthly. Dividends: Reinvested in the paying company until the portfolio is rebalanced.
• Growth of wealth shows the growth of a hypothetical investment of $100 in the securities in the Fama/French US Total Market Research Index from July 1926 through December 2021.
• Gross Domestic Product (GDP) based on quarterly data from the US Bureau of Economic Analysis; quarterly data not available prior to 1947. Percentage change in GDP based on business cycle peak to trough quarter as reported by National Bureau of Economic Research (NBER).
• Industrial Production, Inflation, and Unemployment based on monthly data from Federal Reserve Bank of St. Louis (FRED); Unemployment data not reported prior to 1929.
• All calculations are cumulative.
Data presented in the Growth of Wealth chart is hypothetical and assumes reinvestment of income and no transaction costs or taxes. The chart is for illustrative purposes only and is not indicative of any investment.
Indices are not available for direct investment. Their performance does not reflect the expenses associated with the management of an actual portfolio.
Eugene Fama and Ken French are members of the Board of Directors of the general partner of, and provide consulting services to, Dimensional Fund Advisors LP.
The information in this material is intended for the recipient’s background information and use only. It is provided in good faith and without any warranty or representation as to accuracy or completeness. Information and opinions presented in this material have been obtained or derived from sources believed by Dimensional to be reliable and Dimensional has reasonable grounds to believe that all factual information herein is true as at the date of this material. It does not constitute investment advice, recommendation, or an offer of any services or products for sale and is not intended to provide a sufficient basis on which to make an investment decision. It is the responsibility of any persons wishing to make a purchase to inform themselves of and observe all applicable laws and regulations. Unauthorised reproduction or transmitting of this material is strictly prohibited. Dimensional accepts no responsibility for loss arising from the use of the information contained herein.
“Dimensional” refers to the Dimensional separate but affiliated entities generally, rather than to one particular entity. These entities are Dimensional Fund Advisors LP, Dimensional Fund Advisors Ltd., Dimensional Ireland Limited, DFA Australia Limited, Dimensional Fund Advisors Canada ULC, Dimensional Fund Advisors Pte. Ltd, Dimensional Japan Ltd. and Dimensional Hong Kong Limited. Dimensional Hong Kong Limited is licensed by the Securities and Futures Commission to conduct Type 1 (dealing in securities) regulated activities only and does not provide asset management services.
Risks
Investments involve risks. The investment return and principal value of an investment may fluctuate so that an investor’s shares, when redeemed, may be worth more or less than their original value. Past performance is not a guarantee of future results. There is no guarantee strategies will be successful.
AUSTRALIA and NEW ZEALAND:
This material is issued by DFA Australia Limited (AFS License No. 238093, ABN 46 065 937 671). This material is provided for information only. No account has been taken of the objectives, financial situation or needs of any particular person. Accordingly, to the extent this material constitutes general financial product advice, investors should, before acting on the advice, consider the appropriateness of the advice, having regard to the investor’s objectives, financial situation and needs. Investors should also consider the Product Disclosure Statement (PDS) and the target market determination (TMD) that has been made for each financial product either issued or distributed by DFA Australia Limited prior to acquiring or continuing to hold any investment. Go to au.dimensional.com/funds to access a copy of the PDS or the relevant TMD. Any opinions expressed in this material reflect our judgement at the date of publication and are subject to change.