
Many investors may think a market high is a signal stocks are overvalued or have reached a ceiling. But they may be surprised to find out that the average returns for the S&P 500 Index one, three, and five years after a new market high are similar to the average returns for the index over any one-, three-, or five-year period.
In looking at all 1,000-plus monthly closing levels between 1926 and 2021 for the S&P 500 Index, 30% of the monthly observations were new market highs. After those highs, the average annualized compound returns ranged from over 14% one year later to more than 10% over the next five years. Those results were close to average returns over any given period of the same length. When viewed in terms of the index simply having risen or fallen, the S&P 500 was higher a year after notching a record 82% of the time, and 86% of the time after five years.
EXHIBIT 1
S&P 500 Index Returns
1926-2021
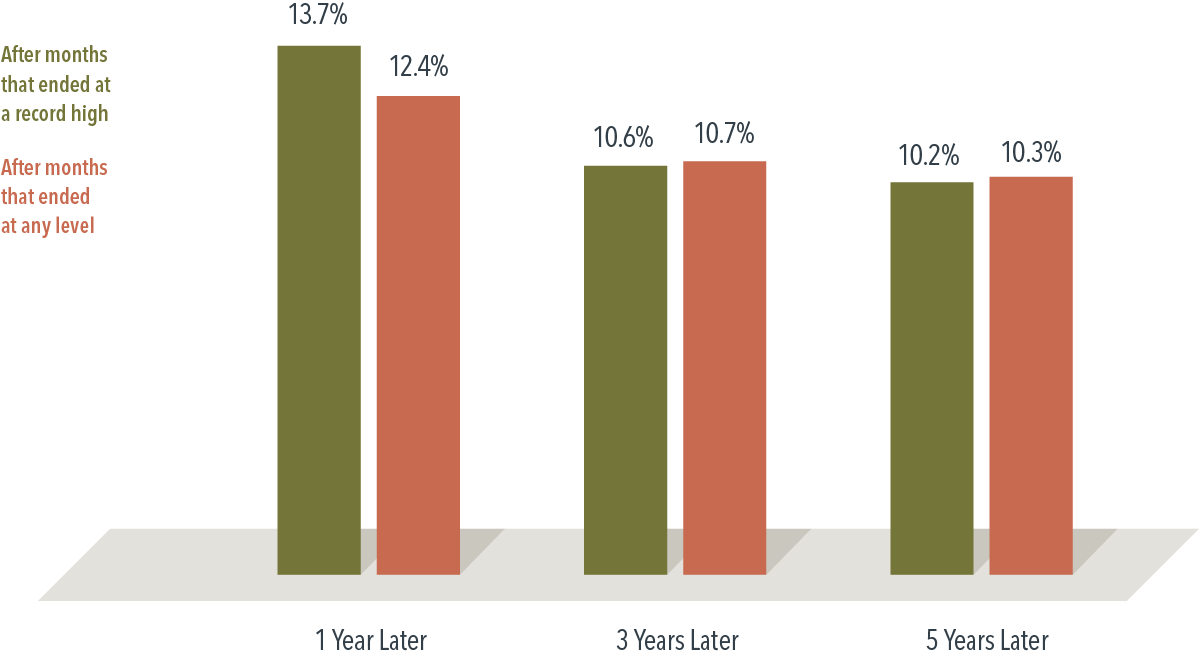
Past performance is no guarantee of future results. Performance may increase or decrease as a result of currency fluctuations.
History shows that reaching a new high doesn’t mean the market will then retreat. In fact, stocks are priced to deliver a positive expected return for investors every day, so reaching record highs with some regularity is exactly the outcome one would expect.
DISCLOSURES & REFERENCES:
The information in this document is provided in good faith without any warranty and is intended for the recipient’s background information only. It does not constitute investment advice, recommendation, or an offer of any services or products for sale and is not intended to provide a sufficient basis on which to make an investment decision. It is the responsibility of any persons wishing to make a purchase to inform themselves of and observe all applicable laws and regulations. Unauthorized copying, reproducing, duplicating, or transmitting of this document are strictly prohibited. Dimensional accepts no responsibility for loss arising from the use of the information contained herein.
“Dimensional” refers to the Dimensional separate but affiliated entities generally, rather than to one particular entity. These entities are Dimensional Fund Advisors LP, Dimensional Fund Advisors Ltd., Dimensional Ireland Limited, DFA Australia Limited, Dimensional Fund Advisors Canada ULC, Dimensional Fund Advisors Pte. Ltd., Dimensional Japan Ltd., and Dimensional Hong Kong Limited. Dimensional Hong Kong Limited is licensed by the Securities and Futures Commission to conduct Type 1 (dealing in securities) regulated activities only and does not provide asset management services.
AUSTRALIA and NEW ZEALAND: This material is issued by DFA Australia Limited (AFS License No. 238093, ABN 46 065 937 671). This material is provided for information only. No account has been taken of the objectives, financial situation or needs of any particular person. Accordingly, to the extent this material constitutes general financial product advice, investors should, before acting on the advice, consider the appropriateness of the advice, having regard to the investor’s objectives, financial situation and needs. Investors should also consider the Product Disclosure Statement (PDS) and the target market determination (TMD) that has been made for each financial product either issued or distributed by DFA Australia Limited prior to acquiring or continuing to hold any investment. Go to au.dimensional.com/funds to access a copy of the PDS or the relevant TMD. Any opinions expressed in this material reflect our judgement at the date of publication and are subject to change.
RISKS
Investments involve risks. The investment return and principal value of an investment may fluctuate so that an investor’s shares, when redeemed, may be worth more or less than their original value. Past performance is not a guarantee of future results. There is no guarantee strategies will be successful.