
Sudden market downturns can be unsettling.
But historically, US equity returns following sharp declines have, on average, been positive.
A broad market index tracking data since 1926 in the US shows that stocks have tended to deliver positive returns over one-year, three-year, and five-year periods following steep declines.
Cumulative returns show this trend to striking effect, as seen in the graph below.
Bouncing Back
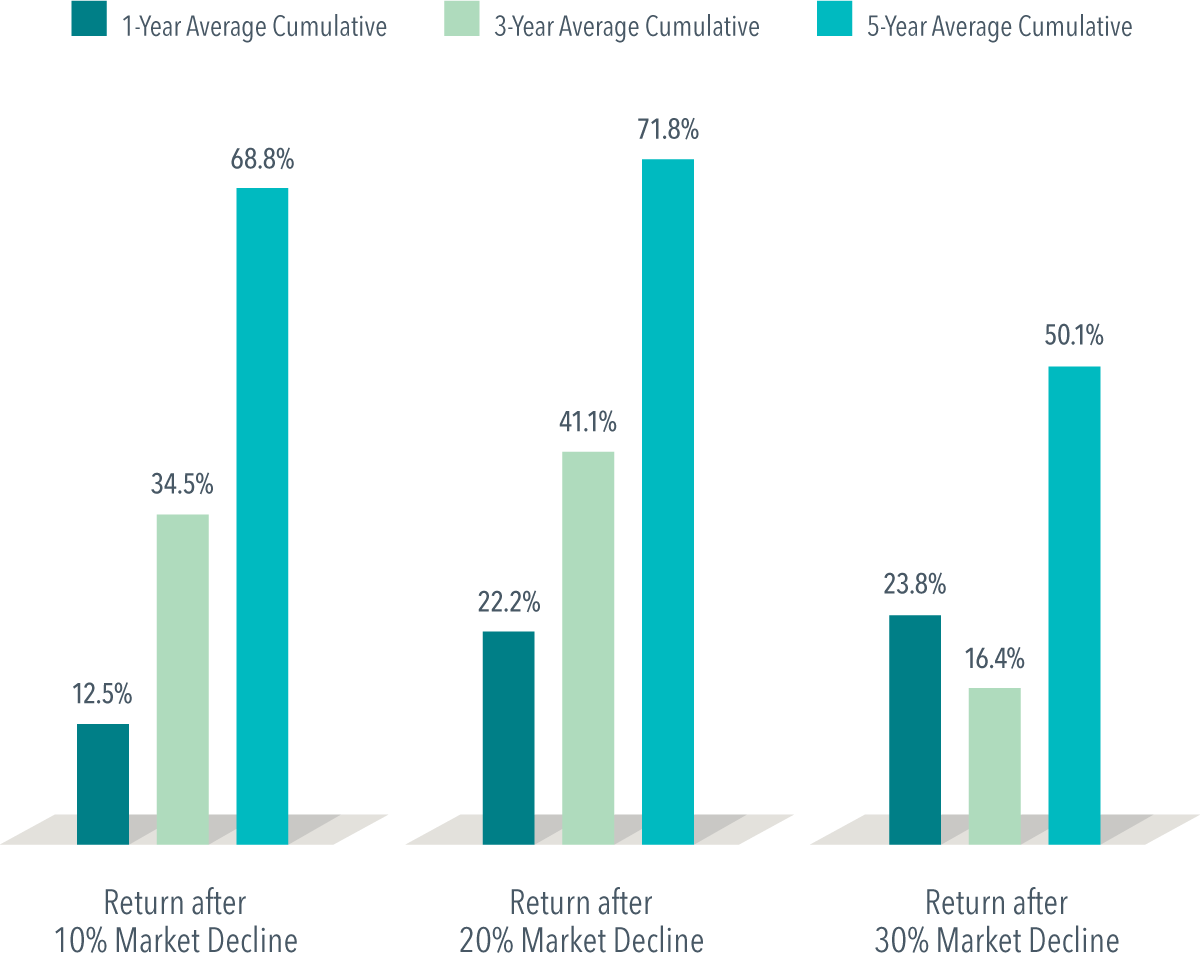
Fama/French Total US Market Research Index Returns, July 1926 – December 2021
Past performance is no guarantee of future results. Short-term performance results should be considered in connection with longer-term performance results. Indices are not available for direct investment. Their performance does not reflect the expenses associated with the management of an actual portfolio.
On average, just one year after a market decline of 10%, stocks rebounded 12.5%. A year after 20% and 30% declines, the cumulative returns topped 20%.
Over three years, stocks bounced back more than 30% from declines of 10% and 20%, although – while still positive – returns were not as impressive after 30% declines.
But five years after market declines of 10%, 20%, and 30%, the average cumulative returns all top 50%.
A look at the data makes a case for sticking with a plan. Handsome rebounds after steep declines can help put investors in position to capture the long-term benefits the markets offer.
DISCLOSURES
In USD. Market declines or downturns are defined as periods in which the cumulative return from a peak is –10%, –20%, or –30% or lower. Returns are calculated for the 1-, 3-, and 5-year look-ahead periods beginning the day after the respective downturn thresholds of –10%, –20%, or –30% are exceeded. The bar chart shows the average returns for the 1-, 3-, and 5-year periods following the 10%, 20%, and 30% thresholds. For the 10% threshold, there are 29 observations for 1-year look-ahead, 28 observations for 3-year look-ahead, and 27 observations for 5-year look-ahead. For the 20% threshold, there are 15 observations for 1-year look-ahead, 14 observations for 3-year look-ahead, and 13 observations for 5-year look-ahead. For the 30% threshold, there are 7 observations for 1-year look-ahead, 6 observations for 3-year look-ahead, and 6 observations for 5-year look-ahead. Peak is a new all-time high prior to a downturn. Data provided by Fama/French and available at mba.tuck.dartmouth.edu/pages/faculty/ken.french/data_library.html.
Eugene Fama and Ken French are members of the Board of Directors of the general partner of, and provide consulting services to, Dimensional Fund Advisors LP.
FAMA/FRENCH TOTAL US MARKET RESEARCH INDEX: 1926-present: Fama/French Total US Market Research Factor + One-Month US Treasury Bills. Source: Ken French website.
The information in this material is intended for the recipient’s background information and use only. It is provided in good faith and without any warranty or representation as to accuracy or completeness. Information and opinions presented in this material have been obtained or derived from sources believed by Dimensional to be reliable and Dimensional has reasonable grounds to believe that all factual information herein is true as at the date of this material. It does not constitute investment advice, recommendation, or an offer of any services or products for sale and is not intended to provide a sufficient basis on which to make an investment decision. It is the responsibility of any persons wishing to make a purchase to inform themselves of and observe all applicable laws and regulations. Unauthorised reproduction or transmitting of this material is strictly prohibited. Dimensional accepts no responsibility for loss arising from the use of the information contained herein.
“Dimensional” refers to the Dimensional separate but affiliated entities generally, rather than to one particular entity. These entities are Dimensional Fund Advisors LP, Dimensional Fund Advisors Ltd., Dimensional Ireland Limited, DFA Australia Limited, Dimensional Fund Advisors Canada ULC, Dimensional Fund Advisors Pte. Ltd, Dimensional Japan Ltd. and Dimensional Hong Kong Limited. Dimensional Hong Kong Limited is licensed by the Securities and Futures Commission to conduct Type 1 (dealing in securities) regulated activities only and does not provide asset management services.
Risks
Investments involve risks. The investment return and principal value of an investment may fluctuate so that an investor’s shares, when redeemed, may be worth more or less than their original value. Past performance is not a guarantee of future results. There is no guarantee strategies will be successful.
AUSTRALIA and NEW ZEALAND
This material is issued by DFA Australia Limited (AFS License No. 238093, ABN 46 065 937 671). This material is provided for information only. No account has been taken of the objectives, financial situation or needs of any particular person. Accordingly, to the extent this material constitutes general financial product advice, investors should, before acting on the advice, consider the appropriateness of the advice, having regard to the investor’s objectives, financial situation and needs. Investors should also consider the Product Disclosure Statement (PDS) and the target market determination (TMD) that has been made for each financial product either issued or distributed by DFA Australia Limited prior to acquiring or continuing to hold any investment. Go to au.dimensional.com/funds to access a copy of the PDS or the relevant TMD. Any opinions expressed in this material reflect our judgement at the date of publication and are subject to change.